[Top][All Lists]
[Date Prev][Date Next][Thread Prev][Thread Next][Date Index][Thread Index]
Re: [Discuss-gnuradio] digital noise input
|
From: |
Eric Blossom |
|
Subject: |
Re: [Discuss-gnuradio] digital noise input |
|
Date: |
Sat, 18 Nov 2006 10:28:39 -0800 |
|
User-agent: |
Mutt/1.5.9i |
On Fri, Nov 17, 2006 at 10:23:01PM -0800, Oussama Sekkat wrote:
> I actually get a very strange behavior now.
> Every time I rerun my program , the output of the logic analyzer changes.
> But the output that comes up the most often is the one I described before
> where bit 1 toggles, and bit 5 is asserted (sometimes) .
>
> What I am trying to do is to get some delay measurements in the following
> way: if 12 bit input (say rx_a) is larger than a certain threshold, than I
> assert a signal in a register. So for this reason I am trying to see what's
> the digital "value" of the noise input in order to have an idea on how to
> set the threshold.
> Has anyone done any such thresholding measurements? Is there a good or
> 'basic' threshold that I could use for my measurements?
>
> Any suggestion would be greatly appreciated.
>
> Thank you,
> Oussama.
OK folks,
It's hard to do remote diagnosis, but here are some observations:
Matt and I have successfully used this strategy to debug code running
in the FPGA. It work as expected.
Using the standard fpga build, this stuff is wired to the pins if
debug is enabled:
.debug_0(rx_debugbus),
.debug_1(ddc0_in_i),
.debug_2({rx_sample_strobe,strobe_decim,serial_strobe,serial_addr}),
.debug_3({rx_dsp_reset,tx_dsp_reset,rx_bus_reset,tx_bus_reset,enable_rx,
tx_underrun,rx_overrun,decim_rate})
rx_debugbus is connected like this:
// Debugging Aids
assign debugbus[0] = RD;
assign debugbus[1] = rx_overrun;
assign debugbus[2] = read_count[8];
assign debugbus[3] = rx_full;
assign debugbus[4] = rxstrobe;
assign debugbus[5] = usbclk;
assign debugbus[6] = have_pkt_rdy;
assign debugbus[10:7] = store_next;
//assign debugbus[15:11] = rxfifolevel[4:0];
assign debugbus[15:11] = bitwidth;
debug_0 comes out on TX_A
debug_1 comes out on RX_A
debug_2 comes out on TX_B
debug_3 comes out on RX_B
Note that the USB clock is on bit 5 of debug_0 (== TX_A)
It will be running at 48 MHz. If you output enable and FR_DEBUG_EN
you _will_ see this! See more below
You have to:
* output enable the pins
* write a suitable value to FR_DEBUG_EN register
u._write_fpga_reg(FR_DEBUG_EN, 0xf) will enable all debug outputs
This is only safe if you are using basic or LF tx/rx d'boards.
Are you sure that you know how to drive your logic analyzer?
Have you tried probing the pins with an oscilloscope?
Do you have a proper ground hooked up to your LA and/or oscope?
I have just confirmed this info as follows:
USRP with only a BASIC_TX on side A
>From the command line I typed this:
address@hidden ~]$ python
Python 2.4.2 (#1, Oct 13 2006, 17:10:51)
[GCC 4.1.0 (SUSE Linux)] on linux2
Type "help", "copyright", "credits" or "license" for more information.
>>> from gnuradio import usrp
>>> from usrp_fpga_regs import *
>>> u=usrp.sink_c(0,64)
>>> u._write_oe(0,0xffff, 0xffff)
True
>>> u._write_fpga_reg(FR_DEBUG_EN, 0x1)
True
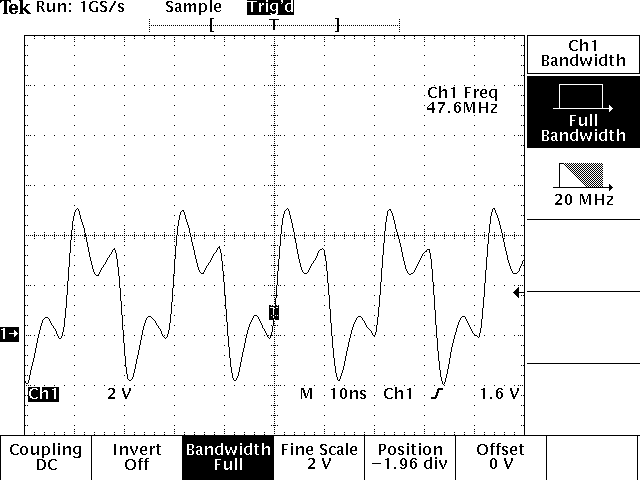
Then I fired up my trust o'scope and probed the pin labeled io_tx(5) on
J50 on the Basic Tx. To get this I used a very short ground
connection (about 1/4 inch) from my scope probe to one of the pins
labeled DGND on J50
The o'scope screen shot is attached, and here's a link to the probing
technique http://comsec.com/images/probe-technique.jpg
Eric
 usbclk.png
Description: PNG image
- [Discuss-gnuradio] digital noise input, Oussama Sekkat, 2006/11/10
- Re: [Discuss-gnuradio] digital noise input, Eric Blossom, 2006/11/10
- Re: [Discuss-gnuradio] digital noise input, Oussama Sekkat, 2006/11/10
- Re: [Discuss-gnuradio] digital noise input, Eric Blossom, 2006/11/11
- Re: [Discuss-gnuradio] digital noise input, Oussama Sekkat, 2006/11/17
- Re: [Discuss-gnuradio] digital noise input, Eric Blossom, 2006/11/17
- Re: [Discuss-gnuradio] digital noise input, Oussama Sekkat, 2006/11/17
- Re: [Discuss-gnuradio] digital noise input, Brian Padalino, 2006/11/17
- Re: [Discuss-gnuradio] digital noise input, Oussama Sekkat, 2006/11/18
- Re: [Discuss-gnuradio] digital noise input, Oussama Sekkat, 2006/11/18
- Re: [Discuss-gnuradio] digital noise input,
Eric Blossom <=
- Re: [Discuss-gnuradio] digital noise input, Don Ward, 2006/11/18
- Re: [Discuss-gnuradio] digital noise input, Eric Blossom, 2006/11/18