[Top][All Lists]
[Date Prev][Date Next][Thread Prev][Thread Next][Date Index][Thread Index]
[Discuss-gnuradio] Spectrum Sense: Making Sense of the data
|
From: |
will.palmer |
|
Subject: |
[Discuss-gnuradio] Spectrum Sense: Making Sense of the data |
|
Date: |
Thu, 12 Jul 2007 13:57:36 +0100 |
Hi All,
First of all my apologies on the quality of the email, this is my first
posting to a mailing list and I've tries to go into as much detail as
possible.
We have had a problem making sense of the output we receive from
usrp_spectrum_sense.py in the python examples.
Lines 226 - 232 tell us that:
# FIXME do something useful with the data...
# m.data are the mag_squared of the fft output (they are in the
# standard order. I.e., bin 0 == DC.)
# You'll probably want to do the equivalent of "fftshift" on them
# m.raw_data is a string that contains the binary floats.
# You could write this as binary to a file.
We then proceeded to print m.data and graph the output. Our assumption
was that the data output was incremental i.e started at the center
frequency and ended at the maximum frequency. However the graph did not
match our readings from previous scans of FM radio stations.
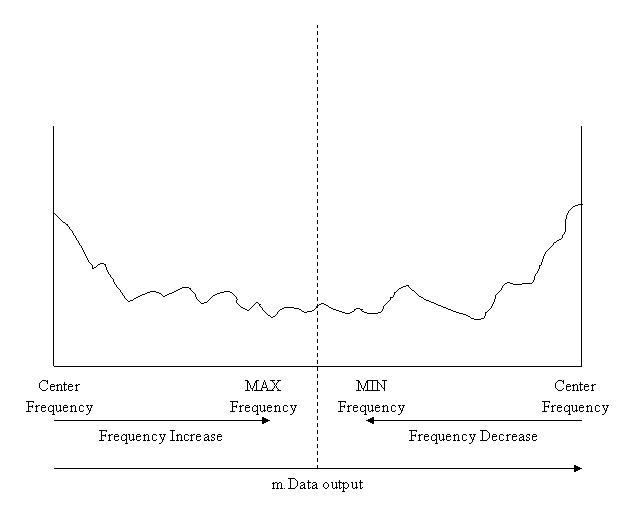
We then continued and used a high power RF signal generator and noticed
that it seemed DC was actually at both ends of the graph with the a
change from min to max in the middle, better explained in the image
attached.
This means the output from m.data is from the center frequency to the
maximum frequency and half way it flips to the minimum frequency and
increases back to the center frequency.
My question basically is does anyone know if our findings in the graph
above correct? And if not can anyone shed some light on what order the
output is in.
Much Appreciated,
Will
 graph.JPG
Description: graph.JPG
- [Discuss-gnuradio] Spectrum Sense: Making Sense of the data,
will.palmer <=