[Date Prev][Date Next][Thread Prev][Thread Next][Date Index][Thread Index]
[Discuss-gnuradio] Tutorial 2.4.5 The Singing Sine Wave
|
From: |
Michael Thelen DK4MT |
|
Subject: |
[Discuss-gnuradio] Tutorial 2.4.5 The Singing Sine Wave |
|
Date: |
Fri, 14 Aug 2015 22:52:33 +0200 |
|
User-agent: |
Mozilla/5.0 (Windows NT 6.3; WOW64; rv:31.0) Gecko/20100101 Thunderbird/31.7.0 |
Hi,
I have two questions to the above mentioned Tutorial chapter, since I
realized two differences, even though I think I set it up the same.
a) To get an acceptable view in the Waterfall graph I had to adjust the
frequency to a fourth of the suggested value in the tutorial picture.
Please compare in my attachment Flowgraph_2-4-5.png, where the value is
marked with a red arrow. Why could that be?
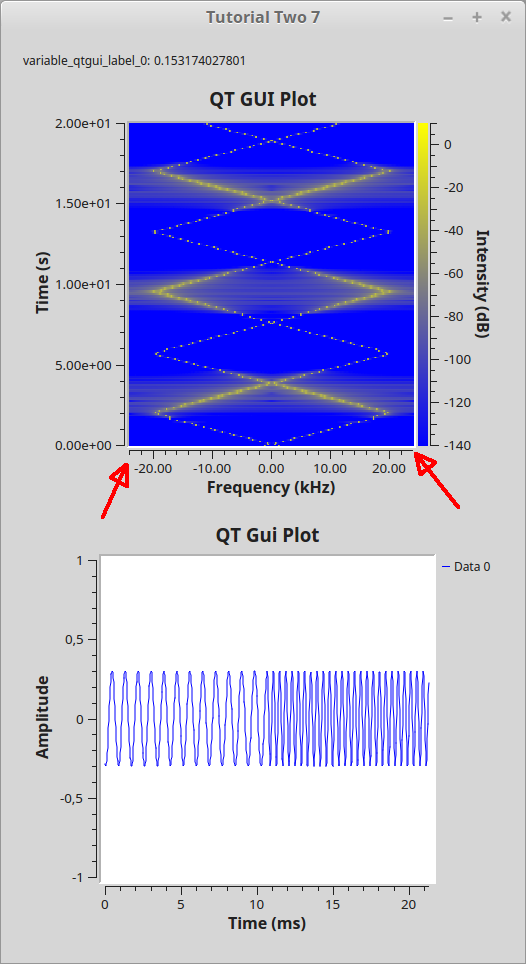
b) How could it be managed to set the X-axis of the Waterfall graph from
-50 to 50 in the picture of the tutorial? In the documentation is stated
that this is related to the bandwidth value of the GUI Waterfall item.
So I could only change this by setting the bandwidth to 100k. But than
the maximum frequency is shown as 40kHz instead of 20kHz and the
triangle pattern stays the same. This does not seem correct, as the
frequency reading would be wrong. Please look at Waterfall_2-4-5.png.
Again marked with red arrows.
Refers to:
http://gnuradio.org/redmine/projects/gnuradio/wiki/Guided_Tutorial_GRC
-- Scroll to 2.4.5
Best regards
Mike
 Flowgraph_2-4-5.png
Description: PNG image
Waterfall_2-4-5.png
Description: PNG image
- [Discuss-gnuradio] Tutorial 2.4.5 The Singing Sine Wave,
Michael Thelen DK4MT <=