Hi Francesco -
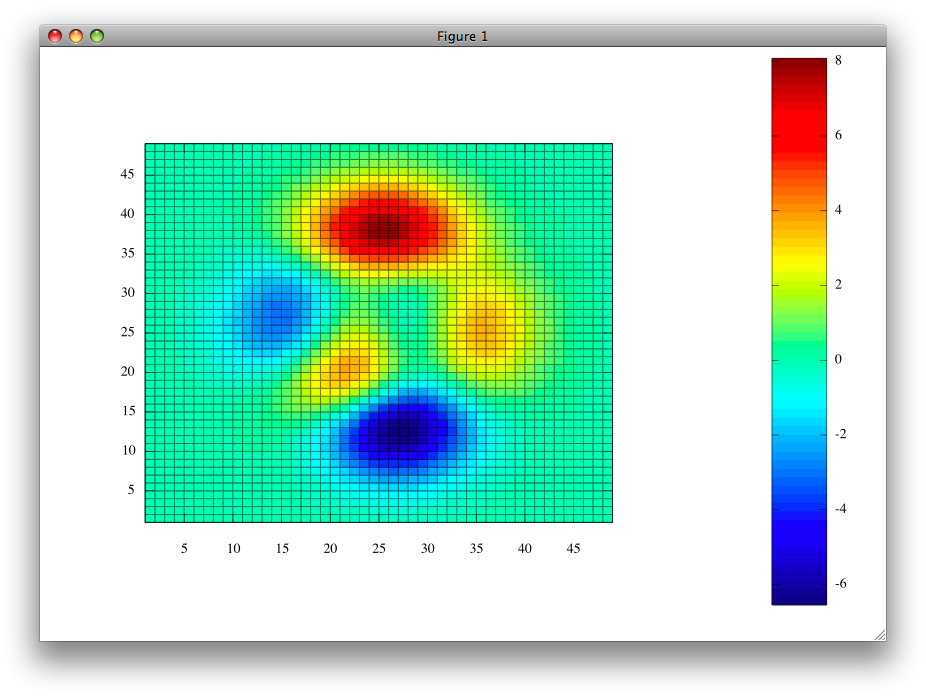
I get the same behavior that you do. See attached screen shot. I'm running on OS X, and I got the same behavior using aquaterm or x11. See attached picture.
OS version: 10.5.4
Octave version: 3.0.2
GNUPlot version: 4.0 patchlevel 0
Perhaps this is a bug in GNUPlot fixed for the 4.2 release?
Charles
On Wed, Sep 10, 2008 at 10:02 AM, Francesco Potorti`
<address@hidden> wrote:
In Octave 3.0.1, I try:
pcolor(peaks()); colorbar
the resulting plot is nice and good, but the colorbar on the right is
too big: its height should be the same as the right axis'.
Well, to be true, it is the plot that is too small: why ever all that
wasted space all around?
This sounds like a bug, but I am not sure.
Is there any workaround? Specifically, I would like to enlarge the plot
without enlarging the colorbar, but I have no idea how: setting the
'outerposition' property enlarges everything, while setting 'position'
does nothing.
--
Francesco Potortì (ricercatore) Voice: +39 050 315 3058 (op.2111)
ISTI - Area della ricerca CNR Fax: +39 050 315 2040
via G. Moruzzi 1, I-56124 Pisa Email: address@hidden
(entrance 20, 1st floor, room C71) Web: http://fly.isti.cnr.it/
_______________________________________________
Help-octave mailing list
address@hidden
https://www-old.cae.wisc.edu/mailman/listinfo/help-octave