[Date Prev][Date Next][Thread Prev][Thread Next][Date Index][Thread Index]
Re: matlab code: isovalues and isosurface
|
From: |
Martin Helm |
|
Subject: |
Re: matlab code: isovalues and isosurface |
|
Date: |
Sat, 16 Jul 2011 14:16:42 +0200 |
|
User-agent: |
KMail/1.13.7 (Linux/2.6.34.8-0.2-desktop; KDE/4.6.5; x86_64; ; ) |
Am Samstag, 16. Juli 2011, 12:46:13 schrieb Liam Groener:
> On Jul 16, 2011, at 2:43 AM, Martin Helm wrote:
> > Am Freitag, 15. Juli 2011, 23:53:44 schrieb Liam Groener:
> >> (2) What I find very confusing is that the failure occurs almost
> >> instantly when the for loop is run from 1 to n, but the code runs for
> >> more than a minute (without failue) if the loop is run from 1 to n-1.
> >> It seems like it is actually running it from n to 1 in the former case?
> >
> > I guess you are using gnuplot as backend? You did not mention it. The
> > reason that the error comes almost instantly is that the loop is very
> > fast, it is finished long before gnuplot starts to show the first plot.
> > So it has nothing to do with the loop running in the wrong order as you
> > suspected but seems to be simply a side effect of the asynchronous
> > behaviour of the plots running in a separate process while the
> > calculations are all finished.
>
> Yes, you are right. I was fooled by the facts that all the plotting
> commands are inside the loop and that most of the cpu time was being used
> by the octave process rather than by gnuplot. I guess that during the
> loop, the gnuplot commands are placed in a que and octave continues
> feeding them to gnuplot over the length of the run?
>
> I have been running with both the gnuplot and fltk backends. I swear I was
> getting similar plots from both earlier in the day (actually yesterday
> now). However, recently, I have not been able to make fltk work. It just
> plots the axes and finishes with no actual plot or error message. The
> m-file I'm currently using reads:
>
> [x,y,z]=meshgrid(-20:.5:20);
> function Psi=FdOn320(x,y,z)
> r=sqrt(x.^2+y.^2+z.^2);
> Psi=exp(-r./3).*(3*z.^2-r.^2).*2*sqrt(15/(120*pi))/81;
> endfunction
> Psi=FdOn320(x,y,z);
> m=min(Psi(:));
> M=max(Psi(:));
> color=[1 1 0;1 0 1; 0 1 1;0 1 0;1 0 0; 0 0 1; 0 0 0];
> n=5;
> for i=1:n-1
> isovalue=m+i*(M-m)/n;
> fv = isosurface(x,y,z,Psi,isovalue);
> hpatch = patch(fv);
> isonormals(x,y,z,Psi,hpatch);
> Alphalevel=0.2+0.8*i/n;
>
> set(hpatch,'FaceAlpha',Alphalevel,'FaceColor',color(i,:),'EdgeColor','none
> ') set(hpatch,'FaceColor',color(i,:),'EdgeColor','none')
> daspect([1,1,1])
> view(3);
> axis tight
> % camlight left;
> end
> s = 'hi'
>
> Earlier, I was trying small variations in this. Note that I uncommented out
> the daspect command since octave 3.4.2 supports it. I just added the last
> line, my crude way of verifying that the loop finishes fast as you said.
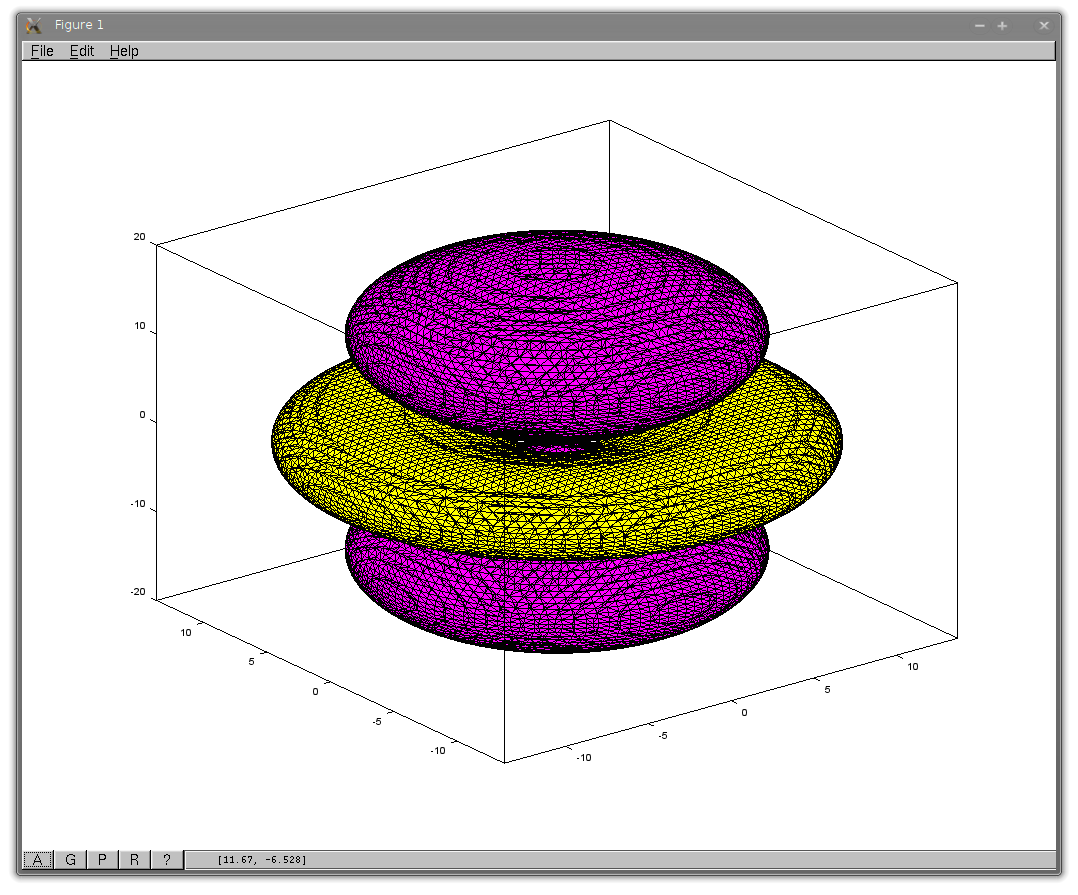
I quickly checked that with fltk since I remembered that the transparency did
not work with fltk when I last tried it.
If you remove the line with the FaceAlpha setting the graphics will be
rendered. Choosing
set(hpatch,'FaceColor',color(i,:),'EdgeColor','black')
in the loop gives the attached image.
 surface.png
Description: PNG image
- matlab code: isovalues and isosurface, Uwe Brauer, 2011/07/15
- Re: matlab code: isovalues and isosurface, Liam Groener, 2011/07/15
- Re: matlab code: isovalues and isosurface, Martin Helm, 2011/07/16
- Re: matlab code: isovalues and isosurface, Liam Groener, 2011/07/16
- Re: matlab code: isovalues and isosurface,
Martin Helm <=
- Re: matlab code: isovalues and isosurface, Uwe Brauer, 2011/07/16
- Re: matlab code: isovalues and isosurface, Martin Helm, 2011/07/16
- still problems, version? (was: matlab code: isovalues and isosurface), Uwe Brauer, 2011/07/16
- Re: still problems, version? (was: matlab code: isovalues and isosurface), Martin Helm, 2011/07/16
- Re: still problems, version? (was: matlab code: isovalues and isosurface), Martin Helm, 2011/07/16
- precompiled 3.4 for Debian/Ubuntu: was Re: still problems, version?, Uwe Brauer, 2011/07/17
- Re: precompiled 3.4 for Debian/Ubuntu: was Re: still problems, version?, Jordi Gutiérrez Hermoso, 2011/07/17
- Re: precompiled 3.4 for Debian/Ubuntu: was Re: still problems, version?, Uwe Brauer, 2011/07/18
- Re: precompiled 3.4 for Debian/Ubuntu: was Re: still problems, version?, Jordi Gutiérrez Hermoso, 2011/07/18
- Re: precompiled 3.4 for Debian/Ubuntu: was Re: still problems, version?, Uwe Brauer, 2011/07/19