b4=fir2 (100, [0,1/12,1/12,1], [1,1,0,0], 2^24, 2, blackman(101));
save b4_blackman_coefficents.mat b4;
b4_high=-b4;
b4_high(51)=b4_high(51)+1;
figure(1);
plot(b4_high, 'r'); hold on;
title(strcat('K',char(245),'rgp', char(228), char(228), 'sfiltri FIR koefitsendid'));
xlabel(strcat('V',char(245),'endi number')); ylabel('FIR filtri koefitsent');
legend({"Spektraalselt inverteeritud sinc"}); legend("location", "northeast");
axis([0, 101, -0.1,1]);
hold off;
[H4,w4]=freqz(b4);
[H4_high,w4_high]=freqz(b4_high);
figure(2);
subplot(3,1,1);
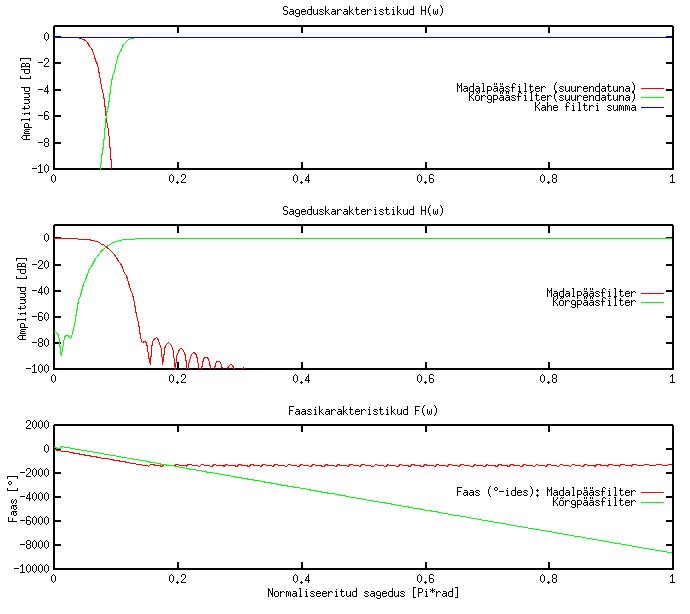
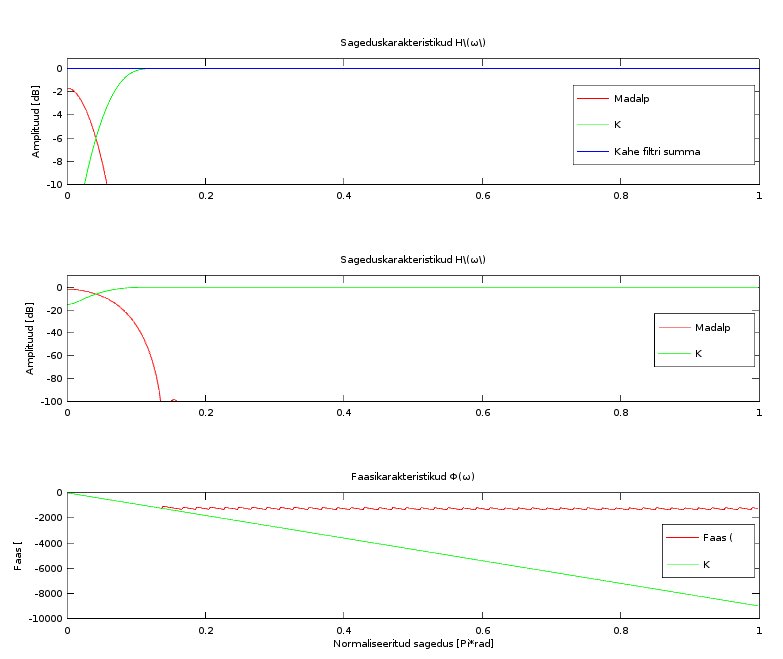
plot(w4/pi,20*log10(abs(H4)),'r');
hold on;
plot(w4_high/pi,20*log10(abs(H4_high)),'g');
plot(w4/pi,20*log10((abs(H4)+abs(H4_high))/1),'b');
title('Sageduskarakteristikud H\(\omega\)'),
ylabel('Amplituud [dB]'),
legend({strcat('Madalp',char(228), char(228), 'sfilter (suurendatuna)'), strcat('K',char(245), 'rgp', char(228), char(228), 'sfilter(suurendatuna)'),"Kahe filtri summa" });
legend("location", "east");
axis([0, 1, -10,0.85]);
subplot(3,1,2);
plot(w4/pi,20*log10(abs(H4)),'r');
hold on;
plot(w4_high/pi,20*log10(abs(H4_high)), 'g');
%plot(w4/pi,20*log10((abs(H4)+abs(H4_high))/1),'b');
title('Sageduskarakteristikud H\(\omega\)');
ylabel('Amplituud [dB]');
legend({strcat('Madalp',char(228), char(228), 'sfilter'), strcat('K',char(245), 'rgp', char(228), char(228), 'sfilter'),"Kahe filtri summa"});
legend("location", "east");
axis([0, 1, -100,10]);
subplot(3,1,3);
plot(w4/pi,(unwrap (arg (H4))*360/(2*pi)),'r');
hold on;
plot(w4_high/pi,(unwrap (arg (H4_high))*360/(2*pi)),'g');
title('Faasikarakteristikud \Phi(\omega)');
ylabel(strcat('Faas [',char(176),']'));
xlabel ("Normaliseeritud sagedus [\Pi*rad]");
legend ({strcat('Faas (',char(176), '-ides): Madalp', char(228), char(228), 'sfilter'), strcat('K',char(245), 'rgp', char(228), char(228), 'sfilter')}, "location", "east");
hold off;