[Date Prev][Date Next][Thread Prev][Thread Next][Date Index][Thread Index]
Problem with PostScript output of surface plot
|
From: |
David M. Cook |
|
Subject: |
Problem with PostScript output of surface plot |
|
Date: |
Thu, 5 May 2016 20:18:16 +0000 |
5 May 2016
This is a response to Mike Miller's response to my inquiry of yesterday. For
some reason the email sent to the address address@hidden is bouncing back to
me, having apparently been redirected to address@hidden and rejected. I am
therefore sending it to address@hidden Please forward it specifically to Mike.
Thank you.
David
David M. Cook VOICE: 920-832-6721
Department of Physics FAX: 920-832-6962
Lawrence University Email: address@hidden
711 E Boldt Way, SPC24
Appleton, WI 54911
-----Original Message-----
From: David M. Cook
Sent: Thursday, May 05, 2016 3:12 PM
To: 'Mike Miller' <address@hidden>
Subject: Re: Problem with PostScript output of surface plot
5 May 2016
Mike,
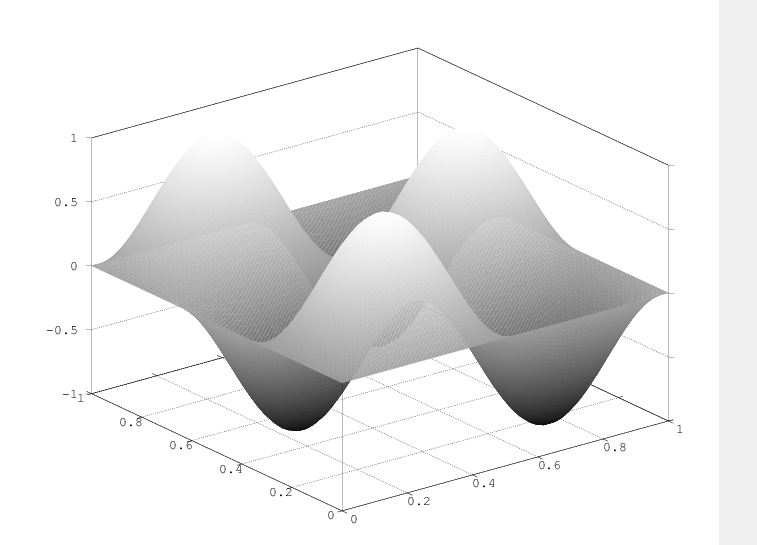
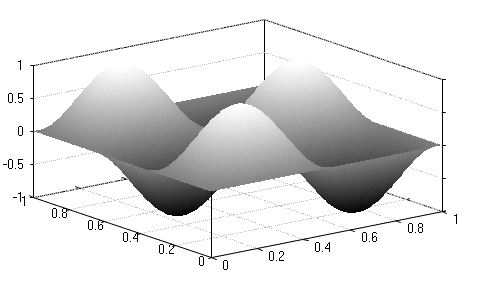
Thanks for your prompt response. I have attached two screen copies. The file
EPSfile.JPG is a screen copy of the display with ghostview of the EPS file
produced by the script below including the print command; the file
GNUPLOToutput.JPG is a screen copy of the display produced on the screen
directly by OCTAVE (i.e., the script below without the print command). The
latter looks fine; the former has some shadows of structure that, I think,
ought to be hidden.
David
David M. Cook VOICE: 920-832-6721
Department of Physics FAX: 920-832-6962
Lawrence University Email: address@hidden
711 E Boldt Way, SPC24
Appleton, WI 54911
-----Original Message-----
From: Mike Miller [mailto:address@hidden
Sent: Thursday, May 05, 2016 2:01 PM
To: David M. Cook <address@hidden>
Cc: 'address@hidden' <address@hidden>
Subject: Re: Problem with PostScript output of surface plot
On Wed, May 04, 2016 at 19:42:36 +0000, David M. Cook wrote:
> 4 May 2016
>
> Greetings,
>
> Executing the script
>
> graphics_toolkit( 'gnuplot' )
> [x,y] = meshgrid( [0.0:0.02:1.0], [0.0:0.02:1.0] ); z = sin(2.0*pi*x)
> .* sin(3.0*pi*y);
> surf(x,y,z)
> colormap( 'gray' )
> shading( 'interp' )
>
> produces a very satisfactory surface plot of the 2-3 mode of a
> vibrating square membrane. (I am running on a Windows 7 computer with
> Version 4.0.0 of OCTAVE.)
>
> I have attached the PostScript file created by the statement
>
> print -deps2 trial.eps
>
> executed after the above code has been executed. This display is not quite
> an accurate transcription of the on-screen display produced by OCTAVE.
>
> Have I discovered a bug, a feature, or an oversight on my part of some
> additional command I should execute? The on-screen display is correct; the
> PostScript file is not.
>
> Thank you for your help.
I don't see any problems on my system or with the attached file.
People don't always see the same things, it would be helpful if you would
attach a screenshot of what you see in the figure that looks correct, and also
a screenshot of what you see when you open the eps file on your system.
I'm attaching a screenshot of what the eps file you attached looks like when I
view it.
--
mike
 EPSfile.JPG
Description: EPSfile.JPG
GNUPLOToutput.JPG
Description: GNUPLOToutput.JPG