Description: PNG image
|
| From: | Colin Macdonald |
| Subject: | Re: plot help |
| Date: | Tue, 29 Apr 2014 22:57:20 +0100 |
| User-agent: | Mozilla/5.0 (X11; Linux x86_64; rv:24.0) Gecko/20100101 Thunderbird/24.4.0 |
On 29/04/14 22:47, Rik wrote:
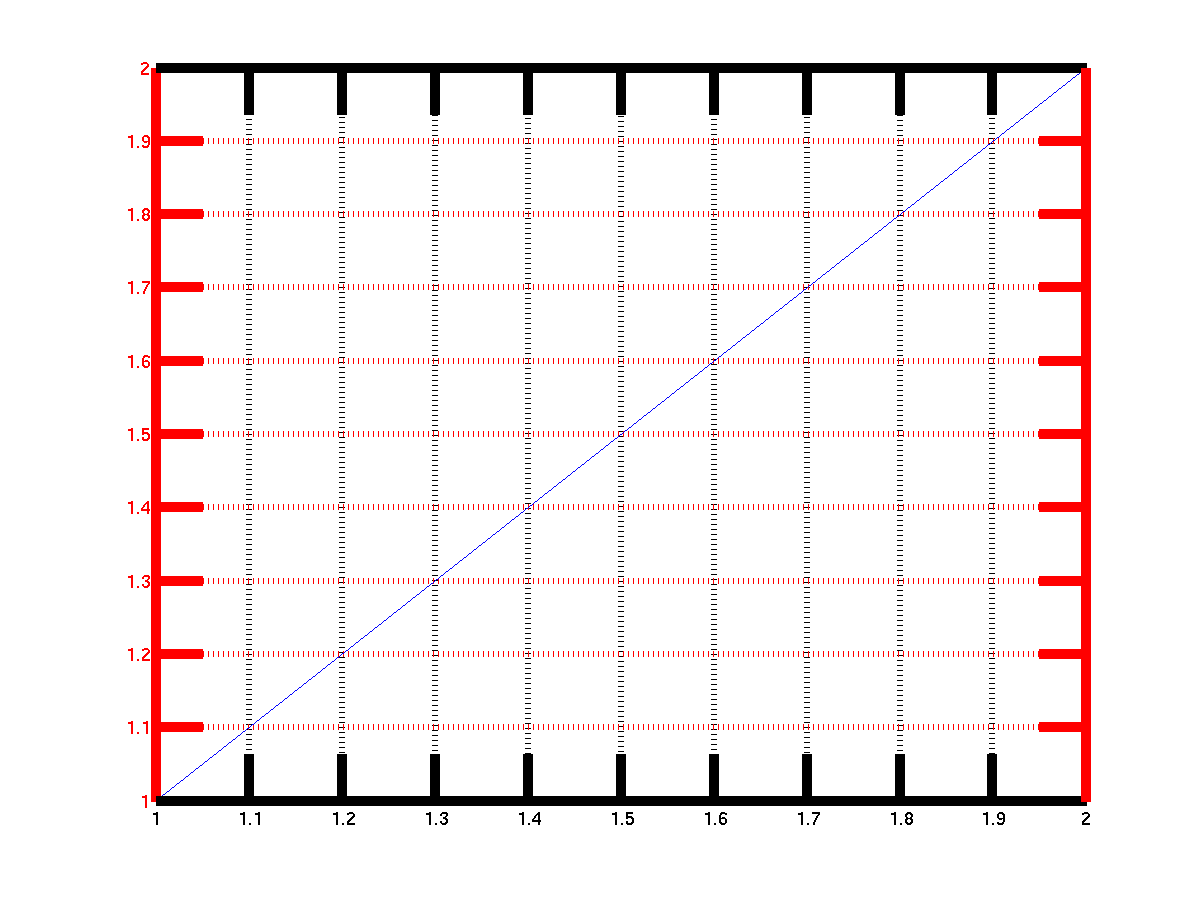
Could someone run the following code under Matlab and post the picture?
I'm trying to see whether tickmarks are plotted over the lines that form
the axes or not.

plot (1:2)
grid on
set (gca, 'linewidth', 5, 'ycolor', 'r', 'ticklength', [0.05, 0.05])
saveas (gcf, 'tst.png')
![]() tst.png
tst.png
Description: PNG image
| [Prev in Thread] | Current Thread | [Next in Thread] |