bug-apl
[Top][All Lists]
Advanced

[Date Prev][Date Next][Thread Prev][Thread Next][Date Index][Thread Index]

Re: [Bug-apl] Performance optimisations: Results


From: Juergen Sauermann
Subject: Re: [Bug-apl] Performance optimisations: Results
Date: Tue, 01 Apr 2014 18:40:07 +0200
User-agent: Mozilla/5.0 (X11; Linux i686; rv:17.0) Gecko/20130330 Thunderbird/17.0.5

Hello,

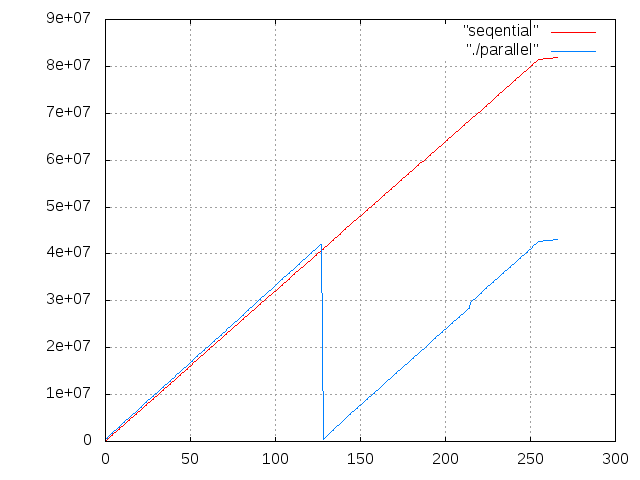
I would like to share some benchmarks on my dual-core (yes, I am a poor guy) machine.
The benchmark measures A+A with A←1048576⍴2. The y-axis shows the CPU cycle counter
which was recorded every 4096 iterations (so we have 256 samples on the x-axis). The first value
was 0 (befor the loop was entered) and the final value was after exiting the loop
(in SkalarFunction::eval_skalar_AB().

The way I read these results is that the inner loop for skalar function scales linearly on a 2-core machine.

If the total time scales worse then either the sequential part is too big (Amdahls law), or something else is wrong.
For example in one of my first tests everything compiled fine but still only one core was used.

/// Jürgen


On 03/14/2014 05:18 PM, David Lamkins wrote:
This is interesting. The parallel speedup on your machine using TBB is in the same ballpark as on my machine using OpenMP, and they're both delivering less than a 2:1 speedup.

I informally ran some experiments two nights ago to try to characterize the behavior. On my machine, with OpenMP #pragmas on the scalar loops, the ratio of single-threaded to multi-threaded runtimes held stubbornly at about 0.7 regardless of the size of the problem. I tried integer and float data, addition and power, with ravels up to 100 million elements. (My smallest test set was a million elements; I still need to try smaller sets to see whether I can find a knee where the thread setup overhead dominates and results in a runtime ratio greater than 1.)

I'm not sure what this means, yet. I'd hoped to see some further improvement as the ravel size increased, despite the internal inefficiencies. TBH, I didn't find and annotate the copy loop(s); that might have a lot to do with my results. (I did find and annotate another loop in check_value(), though. Maybe parallelizing that will improve your results.) I'm hoping that the poor showing so far isn't a result of memory bandwidth limitations.

I hope to spend some more time on this over the weekend.


P.S.: I will note that the nice part about using OpenMP is that there's no hand-coding necessary. All you do is add #pragmas to your program; the compiler takes care of the rewrites.


---------- Forwarded message ----------
From: "Elias Mårtenson" <address@hidden>
To: "address@hidden" <address@hidden>
Cc: 
Date: Fri, 14 Mar 2014 22:22:15 +0800
Subject: [Bug-apl] Performance optimisations: Results
Hello guys,

I've spent some time experimenting with various performance optimisations and I would like to share my latest results with you:

I've run a lot of tests using Callgrind, which is part of the Valgrind tool (documentation here). In doing so, I've concluded that a disproportionate amount of time is spent copying values (this can be parallelised; more about that below).

I set out to see how much faster I could make simple test program that applied a monadic scalar function. Here is my test program:

∇Z←testinv;tmp
src←10000 4000⍴÷⍳100
'Starting'
tmp←{--------⍵} time src
Z←1

This program calls my time operator which simply shows the amount of time it took to execute the operation. This is of course needed for benchmarking. For completeness, here is the implementation of time:

∇Z←L (OP time) R;start;end
start←⎕AI
→(0≠⎕NC 'L')/twoargs
Z←OP R
→finish
twoargs:
Z←L OP R
finish:
end←⎕AI
'Time:',((end[3]+end[2]×1E6) - (start[3]+start[2]×1E6))÷1E6

The unmodified version of GNU APL runs this in 5037.00 milliseconds on my machine.

I then set out to minimise the amount of cloning of values, taking advantage of the existing temp functionality. Once I had done this, the execution time was reduced to 2577.00 ms.

I then used the Threading Building Blocks library to parallelise two operations: The clone operation and the monadic SkalarFunction::eval_skalar_B(). After this, on my 4-core machine, the runtime was reduced to 1430.00 ms.

Threading Building Blocks is available from the application repositories of at least Arch Linux and Ubuntu, and I'm sure it's available elsewhere too. To test in on OSX I had to download it separately.

To summarise:
  • Standard: 5037.00
  • Reduced cloning: 2577.00
  • Parallel: 1430.00
I have attached the patch, but it's definitely not something that should be applied blindly. I have hacked around is several parts of the code, some of which I can't say I understand fully, so see it as a proof-of-concept, nothing else.

Note that the code that implements the parallelism using TBB is pretty ugly, and the code ends up being duplicated in the parallel and non-parallel version. This can, of course, be encapsulated much nicer if one wants to make this generic.

Another thing, TBB is incredibly efficient, especially on Intel CPU's. I'd be very interested to see how OpenMP performs on this same code.

Regards,
Elias


--

Attachment: two-cores.png
Description: PNG image

Attachment: seqential
Description: Text document

Attachment: parallel
Description: Text document


reply via email to

[Prev in Thread] Current Thread [Next in Thread]