Description: PNG image
|
| From: | Jim Segrave |
| Subject: | [Bug-gnubg] Some idle musings re. ratings |
| Date: | Thu, 11 Sep 2003 01:38:01 +0200 |
| User-agent: | Mutt/1.4.1i |
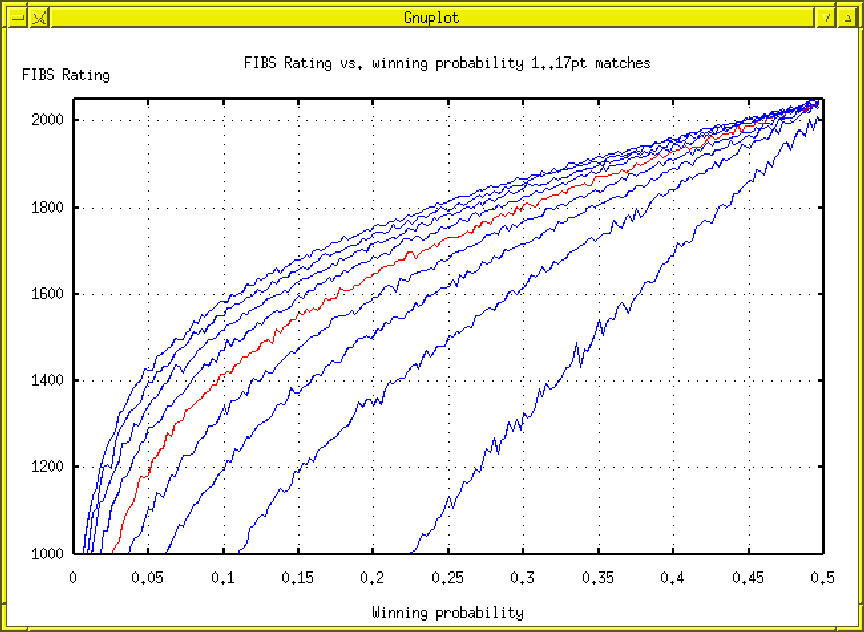
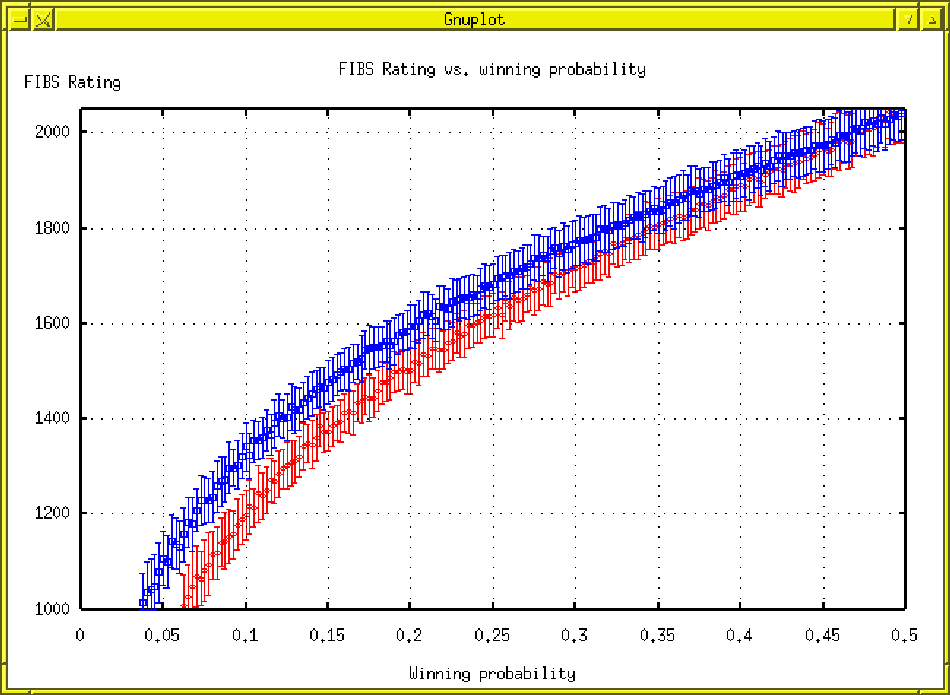
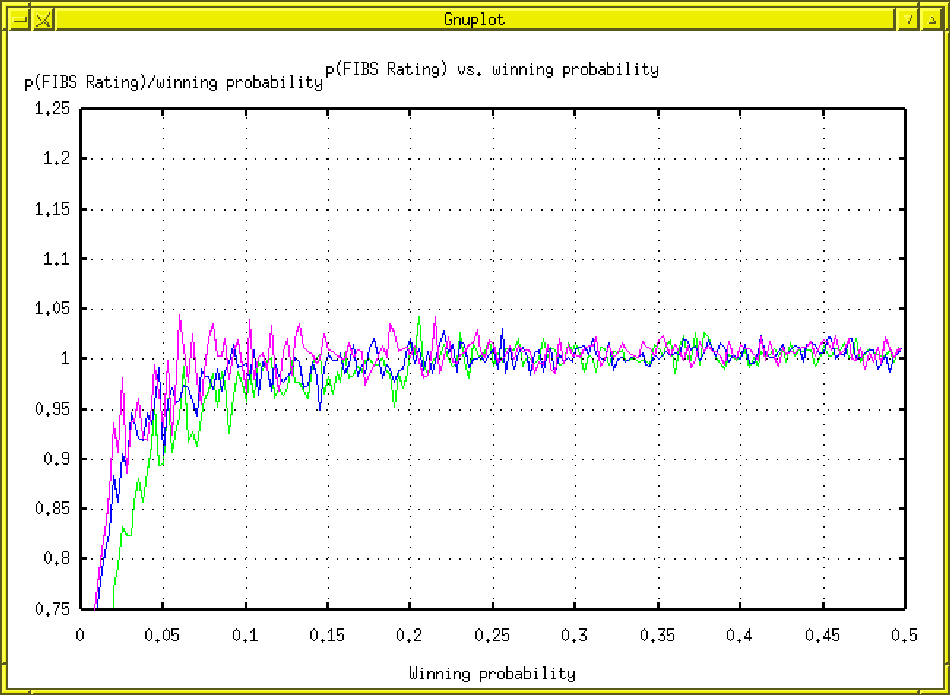
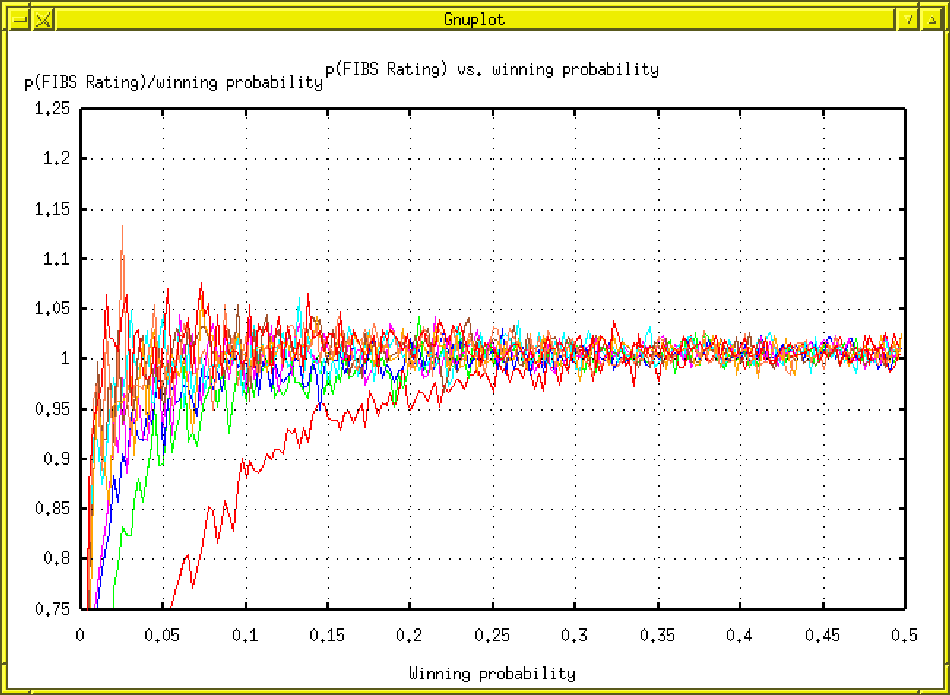
I decided to have a closer look at how the FIBS rating formula behaves
for matches played with gnubg, assuming for the sake of argument that
gnubg plays at a consistent 2050 rating. For amusement, I wrote a
little perl script which for a given match lenght, does a simulation
of a player starting on FIBS at 1500, always playing gnubg and always
having the same MWC, to see how their rating behaved over a large
series of matches and a consistent MWCa. Attached is a graph
(graph.png) which shows the results of 20,000 games at every MWC from
0.25% to 50% in steps of 0.25% and the resulting FIBs rating, run for
match lengths of 1, 3, 5, 7, ... 17. The middle value, match length 9,
has a different colour to make finding things easier and the lowest
line is 1 pointers, the highest is 17 pointers. Note that to produce
a more easily visible graph, I deliberately chopped FIBS ratings below
1000, so the origin of this graph is deliberately omitted.

I also plotted the values and standard deviations for 5 and 7 point
matches to give an indication of what the confidence intervals are on
the resulting estimate of the ratings (5and7pts.png, 7 pointers are
blue, 5 poitners red). It looks like the confidence interval is around
100 FIBS points. It also looks like playing longer matches is very
favourable to the underdog (a 15% MWC is worth about ane extra 400
rating points between 3 point and a 9 point match), but of course the
same error rate would presumably also cost you much more MWC in a long
match than a short one. On the other hand, the very low slope on the
higher match scores makes the spread of possible FIBS values rather

For a final check, I then took the FIBS estimate of your MWC for the
resulting ratings and compared them to the MWC used to produce the
rating in the first place, to see it the results were consistent. One
graph (allcomp.png) shows the results for all the various match
scores, there's a separate one for just 3, 5 and 7 pointers (3 =
green, 5 = blue, 7 = purplish ugly colour). In general, once your MWC
goes over about 20%, the FIBS rating derived MWC <=> MWC used to
generate the FIBS rating is quite close, well within plus/minus 5%.

This is not a realistic model in that no-one ever plays with a
consistent MWC, but I was wondering if we could use the luck adjusted
result as an indicator of MWC to model FIBS ratings and to compare them
to the current function  which Kees van Doel generated.

--
Jim Segrave           address@hidden
![]() graph.png
graph.png
Description: PNG image
![]() 5and7pts.png
5and7pts.png
Description: PNG image
![]() 357comp.png
357comp.png
Description: PNG image
![]() allcomp.png
allcomp.png
Description: PNG image
| [Prev in Thread] | Current Thread | [Next in Thread] |