[Top][All Lists]
[Date Prev][Date Next][Thread Prev][Thread Next][Date Index][Thread Index]
[Discuss-gnuradio] regarding plotting the graph for received data in USR
|
From: |
shantharam balasubramanian |
|
Subject: |
[Discuss-gnuradio] regarding plotting the graph for received data in USRP2 testbed node |
|
Date: |
Wed, 6 Jul 2011 17:26:28 -0400 |
Hi.
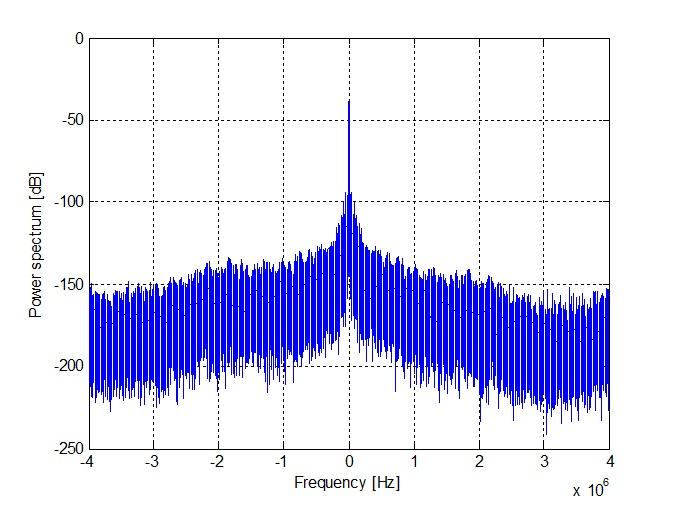
I have been trying to plot the PSD of data which was received on a
receiver node. I got a txt file which was a binary file having all the
received power data.
I had a matlab code to plot it and the graph had a peak in the center
frequency which was abt -48 dB . but then it went down till -220 dB as
we come away from the center freq. I have attached the image file in here.
My professors said its not possible in real time to plot anything
below -120 dB itself. But I have been looking at the data it used and
they were very minimum numbers.
I am not sure why such low power data is coming. Can anyone help me
out with this?
 image.jpg
Description: JPEG image
| [Prev in Thread] |
Current Thread |
[Next in Thread] |
- [Discuss-gnuradio] regarding plotting the graph for received data in USRP2 testbed node,
shantharam balasubramanian <=