Nor do I think a monolithic C program is a great idea,the path that inspectrum has gone -- which seems like way too many lines of code for what its doing.
I really think the most valuable thing would be a lightweight concise python GUI that is easily extensible with lambda functions, new hier blocks wrapping in tree and out of tree blocks in C/C++/python/numpy/tensorflow - and helpful frontends to them which translate knowledge well to the pre-existing python automation layer gnuradio provides.
An intuitively usable GUI which helps inform the existing python API without a bunch of new CLI syntax and arg formatting semantics to learn would be awesome.
-Tim
On Tue, Mar 8, 2016 at 8:41 PM Paul Garver <address@hidden> wrote:
My experience is that the Matplotlib files don’t work particularly well for large files. I find the QT visualization tools using async messages (originating from Tim’s gr-pyqt) more useful in general. This isn’t GR-specific, but Inspectrum [1] has been making a good amount of progress. It handles large files exceptionally well and it’s pretty straightforward to get a decent looking spectrogram. You might take a look to get some ideas for the GR side of things.An idea I’ve had for awhile for offline tools is a way to wrap processing blocks with either a Python or CLI interface with a file source->processing block->file sink so you could perform signals analysis step-by-step. For example, you may have some IQ data and perform a sub-band tune. Call a CLI/Python command something like# filter iq_samples.fc32 iq_samples_subband.fc32 <filter_type> <center_freq> <cutoff>Then, you could use visualization tools to see what happened , say,in the frequency domain. You then perform the next step, say an FM demodulation# demod <type> iq_samples_subband.fc32 subband_demod.f32where type could be, say, FM,PM,AMObviously you can do these steps in GNURadio but you have to continually put file sinks, run the flowgraph, etc.If you are going to develop these sorts of tools with a GUI interface, it sure would be nice to have some Python/CLI type bindings to the backend to implement what I mentioned above. I think there is value in keeping any sort of GUI interface as a front-end which “drives” the back-end to allow for this sort of signals analysis.It would also be great to take metadata into account for the offline tools. Why should I have to type in sample rate, center frequency, etc if the header has it? Also, tells you file type, etc so you could automatically launch the correct version of the tool. If the metadata contains timestamps, those timestamps could be displayed on the GUI along with any associated tags.Hope this helps,PWGFrom: Tom Rondeau <address@hidden>Subject: Re: [Discuss-gnuradio] GSoC Interest in Project: Offline Analysis and Visualization ToolsDate: March 8, 2016 at 5:47:36 PM ESTTo: Usman Haider <address@hidden>Cc: "address@hidden" <address@hidden>On Tue, Mar 8, 2016 at 3:54 PM, Usman Haider <address@hidden> wrote:Hi Nathan,Thanks for your comments. Yes, I have used offline plotting utilities frequently. I think a few interesting and useful things are missing in these utilities that can be added. For example, in one application I wanted to know the DC offset or simply DC value present in a burst. I couldn't do that with original gr_plot_iq so I modified it to get something like this
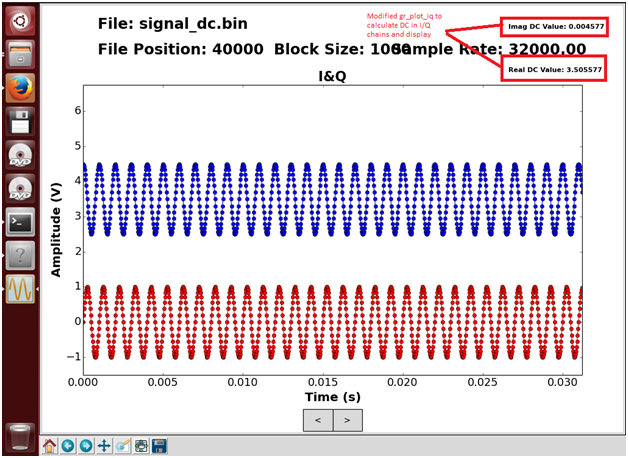
Another on imgurThings in my mind are1. DC calculation and removal from the signal display2. Signal power calculation and display3. Filtering of signal (Highpass, lowpass, etc)4. Mathematical operation (scale/Normalize, raising to power, anyother)5. Saving portion of interest to another file. Often when doing analysis of test data, I came across a portion of data that is interesting (e.g unusual behavior) and I want to save/extract it from file. Currently, not possible.6. Tabbed Display of the signal in various domain unprocessed (time, constellation, spectrum,) processed (mathematical operation, scale/normalize, filtered), I miss this feature because often I want to see spectrum, constellation and I/Q of a burst to see what is going on.7. Also, I am currently thinking of adding an animate/play feature that can play the file slowly i.e user specified rate.These things are often used in offline analysis I think.I will be happy to have feedback and comments on these from the community and things people want to have.Further to discuss the about applying the filter during the offline analysis. To do this following needs to be done behind-the-scenea. Get data from the file file (open file using "open", read desired data using scipy.fromfile()), at start of application.b. Get filter specification from the user using GUI (gain, sample_rate, cutoff_freq, attenuation,window,transition_bw)c. Get filter coefficients using filter specification (filter.firdes.*)d. When user clicks submit/apply button, call a method/function that does the convolution of data with filter coefficients. Also apply group delays adjustment to convolution output.e. Update the filtered data plot and show it to user when user clicks on that tab.f. Give feedback to the user about the e.g order of the filter.From a user perspective, he would have some GUI interface as below, I also marked the QT components that can be used to provide this GUIInput file has to be provided by the user. He can select filter type, input filter parameters to design a filter of interest, and can click on the tabs for view data in the any domain he wants e.g filtered data or original data.That is what currently on my mind. Waiting for feedback.Regards,Usman_______________________________________________I just wanted to point out that there are two sets of these tools. The ones based on Matplotlib like you showed in this email and then the ones based on QTGUI blocks. I made the latter to provide better consistency between the offline and online tools. I'm not saying you have to use this over the matplotlib, but whichever one you select and work on, once it's highly functioning and useful, we should get rid of the others (we'll do that on the GNU Radio side; you just focus on improving the tools).TomOn Tue, Mar 8, 2016 at 3:38 AM, West, Nathan <address@hidden> wrote:Hi Usman,Since you've been using GNU Radio for 3 years now and you have an interest in this project hopefully you have some offline tools that you personally want to see or personal issues with the current offline tools. Perhaps you can explain those a little bit along with some general approaches to how you would do it. This might spark an interesting conversation here that would refine your application. As an example, say you're looking at some signal in this offline tool and you want to apply a filter to it and see what happens. What do you imagine is required to do this both from a behind-the-scenes perspective and from a user perspective?Don't feel restricted to answering my specific question. Pick whatever visualization/analysis is most interesting to you and publicly brainstorm. Someone will probably have commentary or feedback on it.Cheers,NathanOn Sat, Mar 5, 2016 at 1:13 AM, Usman Haider <address@hidden> wrote:Hi,After going through all the GSoC project ideas and relevant GSoC pages. I concluded that I should apply for the following project because it matches my skills most. In this way, I can make my contribution to GnuRadio maximum.Offline Analysis and Visualization Tools ( Mentor Tim O'Shea)I know C++, Python, and QT, so I fulfill the prerequisite criteria. I am using Gnuradio for more than 3 years now. I am on mailing list (Bob) since quite some time. As a first step I made my account on github.Next, I am going to work on my application/proposal. I'll keep visiting mailing list and GSoC pages so that I do not miss anything.Regards,Usman
Discuss-gnuradio mailing list
address@hidden
https://lists.gnu.org/mailman/listinfo/discuss-gnuradio