On 02/07/2017 04:20 PM, Glen I Langston
wrote:
Hello GNU radio folks,Glen:
A few radio astronomer friends have had a very active interest in GNU Radio, butI’m aware of relatively few Radio Astronomy oriented contributions to GNU radio.
This email is a request to start a discussion onsome requirements of Radio Astronomy and the software support they would need.
The main GNU Radio enhancement items on my short list are:1) Averaging of spectra for long periods (minutes to hours), while capturing every spectrum.2) Writing average and transient spectra based on internal and external events.a) Maybe this already exists, but a spectrum message is needed so that averaging can be separated from writing.b) Transient event detection with spectrum (or time sequence) passed to a writing thread.c) When sudden increases of signal are noted, time sequences would be written. (When auto-detected).3) Keeping tracking of information associated with the observing setup. There are large numbers of ancillary datavalues needed to calibrate and map spectral observations (geographic location, precise time, horn/antenna azimuth, elevationgains, device types used for the observations, flags to indicate calibration spectra etc).
I’ve greatly appreciated the GNU Radio software and excellent quality of the GRC and all the code I’ve seen.I’ve extensively modified the ‘FFT sink' to optimize for averaging and added a write component inside that code.Writing inside averaging is probably a mistake, as writing suspends data collection for a short time. I need to learnhow to bring my code up to the GNU Radio quality standards etc and put the existing code in GNU Radio distribution.
Further, can we add a spectra message type in GNUradio so that spectral can be passed to different blocks?To show that good progress has already been made, but still needs quality integration into GNU Radio,
three figures are attached. Using an AIRSPY (10 MHz bandwidth) and GNU radio, I’ve mapped the Milky Way Galaxy in Neutralhydrogen (1420.406 MHz). It would be great if we can get this functionality, with a few significantenhancements, into the standard GNU Radio release.
Observations are just recorded steadily, and spectra written every minute. I’ve left GNU radio recording sky brightness for a weekand the system was still functioning well when I returned. After the data are gathered, the 1 minute spectra arecalibrated and averaged. After averaging, the data are plotted and mapped. All data are ascii format.
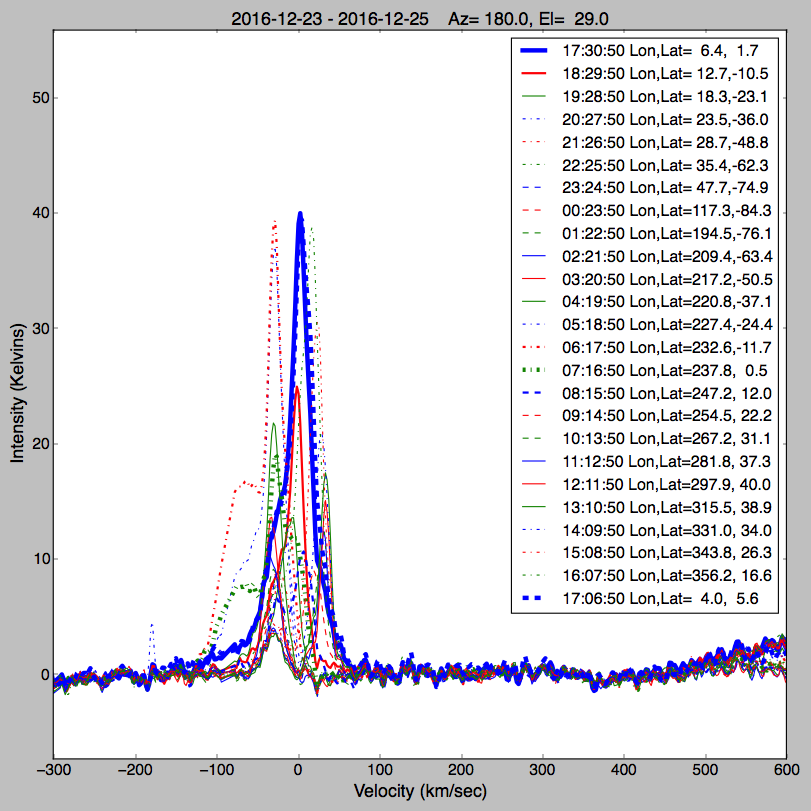
1) The first figure shows one 24 hour observation of the Sky, averaging the signals every hour. The x axis is velocity of the parts of thegalaxy observed and Y axis is intensity. The telescope (horn) was left outside for a day, pointed south with elevation of 29 degreesabove the horizon. The different wiggly curves show different arms of the Milky Way Galaxy.The thick blue and thick blue dashed lines are observations of the Center of the Milky Way galaxy, but one is 24 hourslater than the other. These observations are made with a home made horn antenna, with about 3x3 foot square opening.
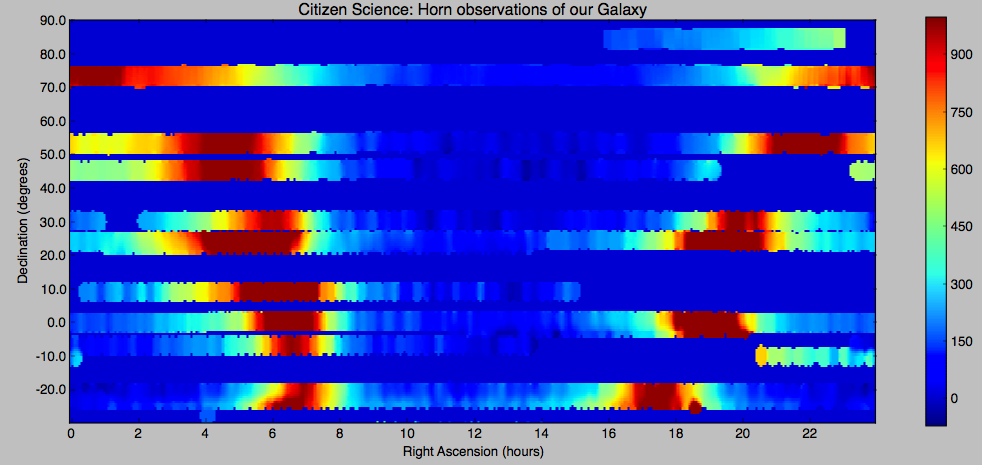
A few days of data were collected to observe much of the northern sky: Image shows Right Ascension on the X axis,which is the time of day in astronomical coordinates. A 24 hour period is shown on the X axis. The Y axisis Declination ( Roughly the Geographic Latitude) of the observation on the Sky.The Dark red regions show the Milky Way galaxy. The dark blue regions are away from the plane of our galaxy.The top line is close to the north pole.
Final figure shows the Galactic Coordinate of the same data.The X axis is Galactic Longitude, with the center of the Milky Way at Galactic Longitude = 0, Latitude = 0.The Y axis is Galactic Latitude, with the plane of the Galaxy at Latitude = 0.0, where most of the Hydrogen is seen.
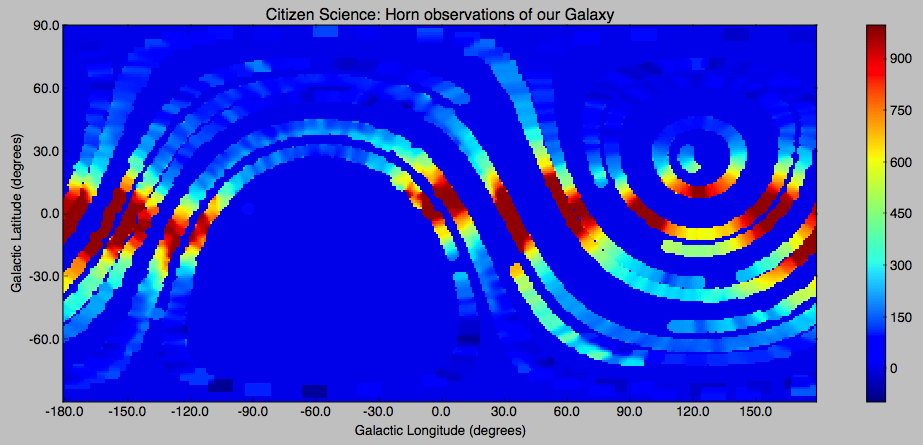 This is the very same data from the previous figure, but with coordinates converted to show the flatness of the galaxy more clearly.Empty region is below the horizon and can not be observed from my back yard. After the software is in GNU Radio,hopefully someone in the southern hemisphere can fill in the gaps.
All the code to do the plotting is in python, but probably is not appropriate for GNU Radio.What should be discussed is how to add a relatively few additional book keeping and data recordingfeatures to GNU radio appropriate for astronomy.
Thanks
Glen
Your results are excellent.
What I will observe is that many of the things you want properly belong in post-processing, rather than in real-time signal processing.
Please look at the ccera GIT repository for relevant RA software written for Gnu Radio:
https://github.com/ccera-astro
In particular, "spectro-radiometer" uses bog-standard Gnu Radio blocks and does both real-time display of averaged spectra, and
derivation of continuum, and logs both on a regular basis. There's also a pulsar processor, which is still under heavy development.
But again, it all uses bog-standard Gnu Radio blocks, and the relatively-new "Python Module" features.
It's entering the territory of "wildly inappropriate" for the Qt GUI (or WxGUI) FFT sinks to also do necessarily-custom data-logging.
Take a look at how spectro_radiometer does things efficiently in this regard.
Cheers
Marcus
On Jan 31, 2017, at 6:33 AM, sushil iyer <address@hidden> wrote:
GSoC Proposal for GNU Radio
GNU radio has been one of the best simulation software platform for designing almost any communication system. In particular, our research expertise exists in the field of software defined radio (cognitive radio). The major utility of cognitive radios (CR) lies in developing a protocol for efficient dynamic spectrum access. As of now, there are various blocks available in the GNU radio companion which help in building different cognitive radio specific systems but our interest is mainly focused over the enhancement of Quality of Experience of CR users (secondary or unlicensed users) through Machine Learning based efficient dynamic spectrum access (DSA).
In GNU radio, we intend to develop a comprehensive Learning based (supervised learning like Artificial Neural Networks, Support Vector Machines, Recurrent Neural Networks, and unsupervised learning like K-means clustering) DSA library which would help the CR research community to immediately design gamut of systems simply by utilizing the blocks present in our library, viz. spectrum prediction, spectrum modeling, spectrum characterization and many more.
We have already published the efficiency of applied machine learning in the context of cognitive radio scenarios thereby providing better and enhanced QoE of CR users and our idea is to extend this horizon towards GNU radio companion so as to better appreciate and qualify the CR research with simplicity, robustness and efficiency.
We would love to be a part of this program and contribute vitally towards the community.
Yours Sincerely
Sushil Iyer
B.Tech Third Year
LNMIIT, Jaipur
_______________________________________________
Discuss-gnuradio mailing list
address@hidden
https://lists.gnu.org/mailman/listinfo/discuss-gnuradio