2017-04-26 15:33 GMT-03:00 Fernando <address@hidden>:
El 26/04/17 a las 20:01, Marcus Müller escribió:
I call it simply spectrum too, maybe I should have said magnitude/phase spectrum.Now I'm confused. Magnitude spectrum is definitely my; but you're just looking for a plot of the DFT, right?
Yes, but not only magnitude(DFT) but also phase(DFT)
So I'd like to get back to my earlier question:
What is the purpose of this?
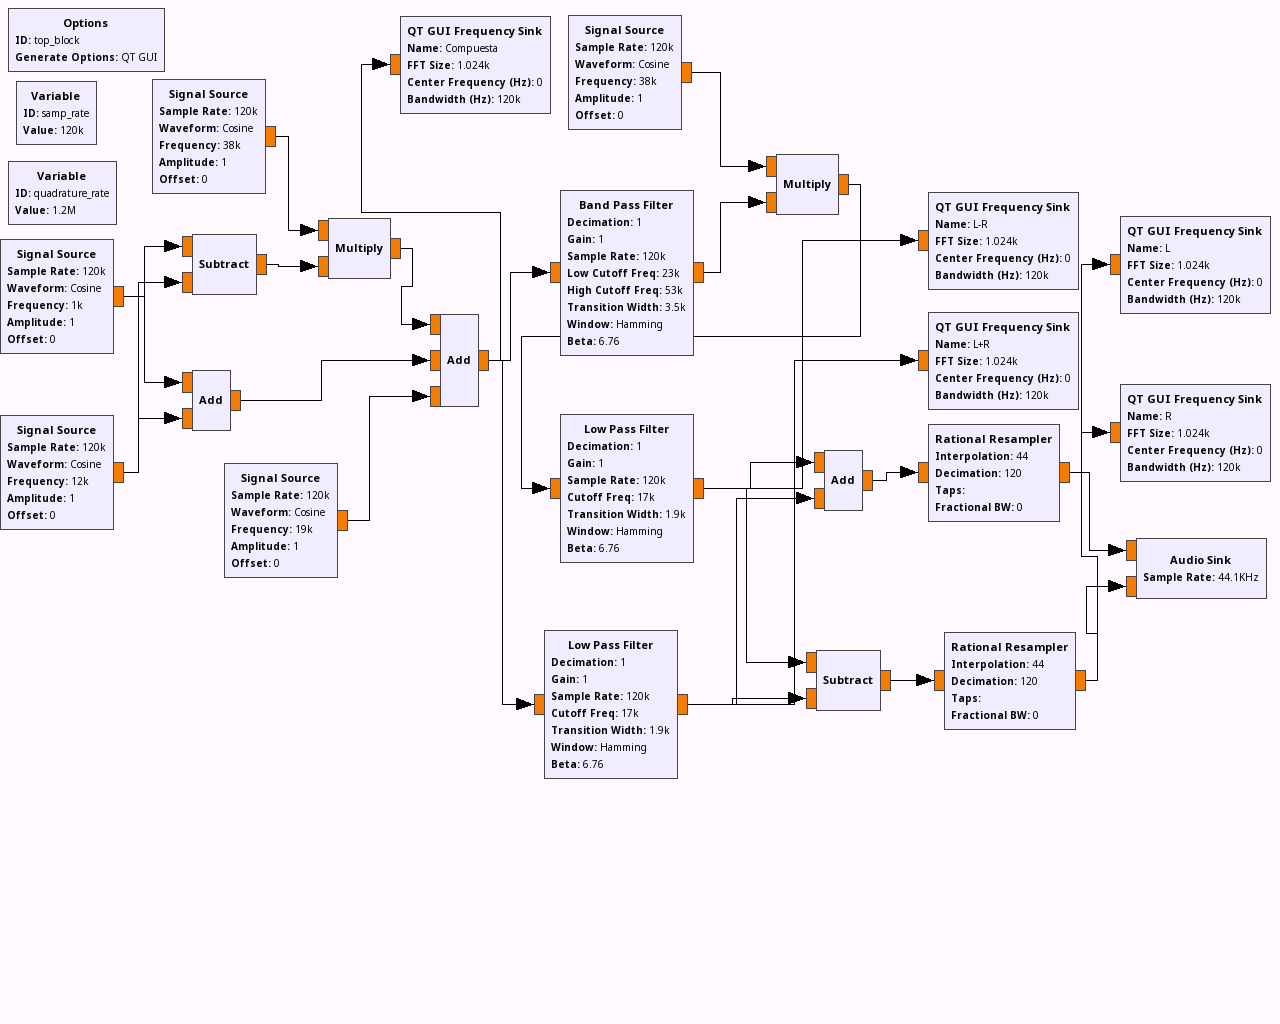
I was doing TX+RX of a FM stereo signal and something did not work. I was searching for the error and I found the error was in the modulation or demodulation, but I could not see where.
This diagram was working faulty, and I thought that maybe I was messing up with signs when doing add/substract, so I wanted to see the spectrum with +/- (or phase)
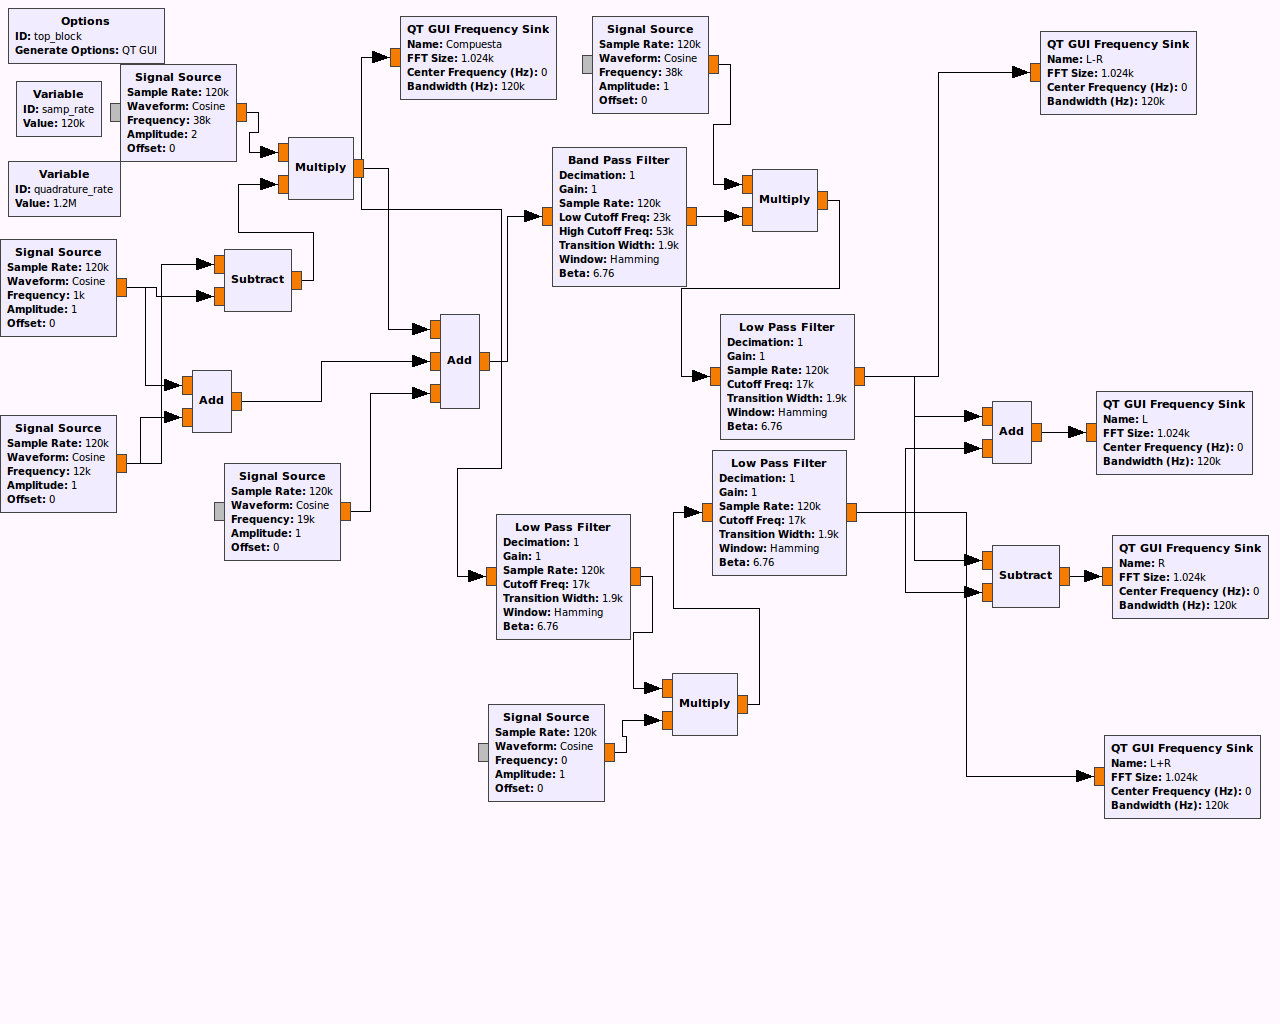
I have found the problem (Thanks to Federico Larroca) and with modifications the diagram works (below) but I still would like to know the previous question
Maybe it is just that I don't understand some things (or a lot of)..... my mathematics knowledge for DSP is far from awsome ;-)
regards
_______________________________________________
Discuss-gnuradio mailing list
address@hidden
https://lists.gnu.org/mailman/listinfo/discuss-gnuradio