2018-06-07 10:11 GMT-03:00 Luis Felipe Albarracin Sanchez <address@hidden>:
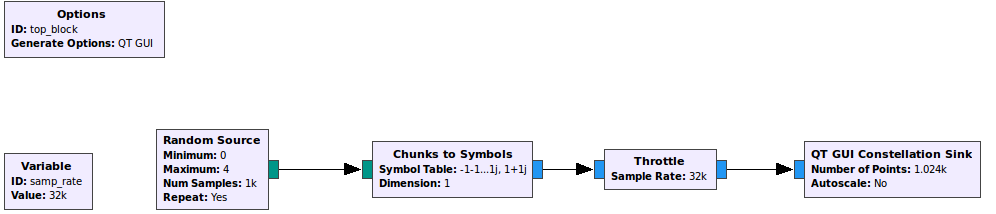
Hello all,Thanks for all the responses,I will try the measurements you just told me Federico, and i will let you know. And yes Ron i used a DPSK Modulator, now i know that it has a root raised cosine filter, and i will try those other blocks you told me.Still, do you have any idea of how i can export data file form GNURadio (the output of a modulator block) and plot the costellation in matlab properly? and also repositories for SNR for different modulations?Thanks again.--On Thu, Jun 7, 2018 at 2:32 PM, Federico 'Larroca' La Rocca <address@hidden> wrote:Hi Luis,For measuring EVM, you may use our gr-mer OOT module: https://github.com/git-artes/gr-mer . Among several measurements, it outputs the MER, which is very similar to the EVM (at least that's my understanding).Now, to output actual constellation points, you should do as Ron suggests: use the block "chunks to symbols". For instance, the attached flowgraph image generates QPSK constellation points randomly and shows them on a constellation sink.bestFederico2018-06-07 7:58 GMT-03:00 Ron Economos <address@hidden>:Are you using the "Constellation Modulator" block? It's really a hierarchical block with a root raised cosine filter. So you're not going to see the original constellation points.
If you just want to see constellation points with the QT GUI Constellation Sink block, you can try the DVB-S2X Modulator in the Digital Television component. It has a bunch of built-in constellations. Or you can use the "Chunks to Symbols" block and define your own constellation.
That's just a starting point. Actual EVM measurements is a complex topic.
Ron
On 06/07/2018 03:24 AM, Luis Felipe Albarracin Sanchez wrote:
Hello Everyone,
I am trying to run a model with different modulations, and to see different measurement values ( Constellation Diagram, EVM, and SNR). i have done the following but it does not seem to work:
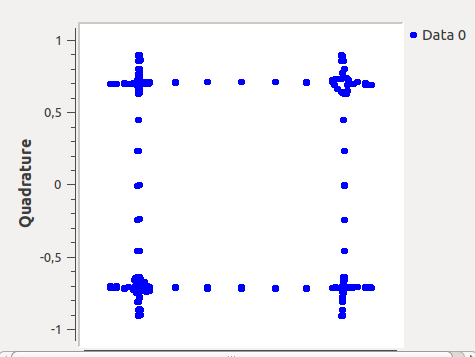
1- I try plotting a DQPSK modulation with "QT GUI Constallation Sink" (directly form the modulating block and it shows a graph like this:
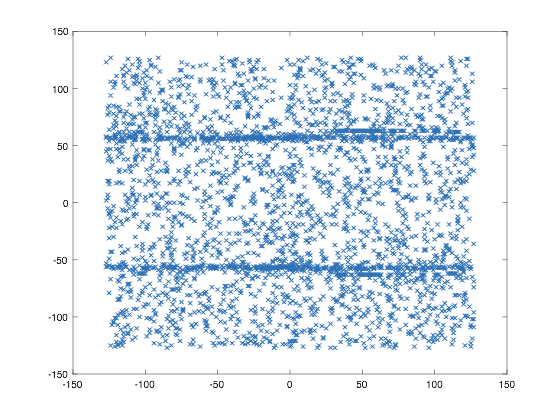
As you can see i have dots that are not where they are supposed to be (in every corner), to try to solve this i placed a "sink file" block from the out of the "modulating block", and i tried to plotted in matlab to see if i had a better image. Unfortunately it went worse. In matlab i read the bin file it showed a row with many numbers (none of them bigger than 255) so i assumed it came formatted every 8 bits .
Fist thing i separated what i have read is the real and the complex part, and i tried to plotted, and it did not work....show many points none of them in the corners where they are supposed to be. After that i thought maybe the Most Significant Bit is the "sign", so i adjusted the program in matlab and ran the plot, but it also did not work.
Below the plot i get:
I wanted this so i can design a program on Matlab to calculate EVM for future measurements, nevertheless i wanted to measure EVM on GNURadio, and also i am looking for a way to measure SNR with different modulations.
Given this, i would appreciate your help with the following:
1- How can i have a graph of the constellation for different modulations in GNURadio, that is accurate.
2- How can i export data file form GNURadio (the output of a modulator block) and plot the costellation in matlab properly?
3- Is there any git repository where i can find blocks for EVM and SNR for different modulations, if not is there a way or known resources, or flowgraphs to do SNR measurements and EVM measurements?
Once again thanks for all the help.
Kind regards.
_______________________________________________ Discuss-gnuradio mailing list address@hidden https://lists.gnu.org/mailman/ listinfo/discuss-gnuradio
_______________________________________________
Discuss-gnuradio mailing list
address@hidden
https://lists.gnu.org/mailman/listinfo/discuss-gnuradio
_______________________________________________
Discuss-gnuradio mailing list
address@hidden
https://lists.gnu.org/mailman/listinfo/discuss-gnuradio
Eng. Luis Felipe Albarracin
PMP
CCNA/CCDA/CCNP/CCDP/CCIP
ITIL v3 Foundation
Msc. Telematics / MBA
"Die Grenzen meiner Sprache bedeuten die Grenzen meiner Welt"