[Top][All Lists]
[Date Prev][Date Next][Thread Prev][Thread Next][Date Index][Thread Index]
Re: [Gnumed-devel] graphical representations of objective parameters
|
From: |
Karsten Hilbert |
|
Subject: |
Re: [Gnumed-devel] graphical representations of objective parameters |
|
Date: |
Sat, 12 May 2012 11:42:44 +0200 |
|
User-agent: |
Mutt/1.5.21 (2010-09-15) |
On Fri, May 11, 2012 at 11:18:58PM +0000, Vaibhav Banait wrote:
> while following up a patient for a long time, you may fail
> to ponder over objective signs which when compared to
> previous visit record may not appear important, but when you
> look at the trend, you may pick up pathologist at early
> stage. few such parameters are weight, vital signs (p, bp)
> Hb, albumin.
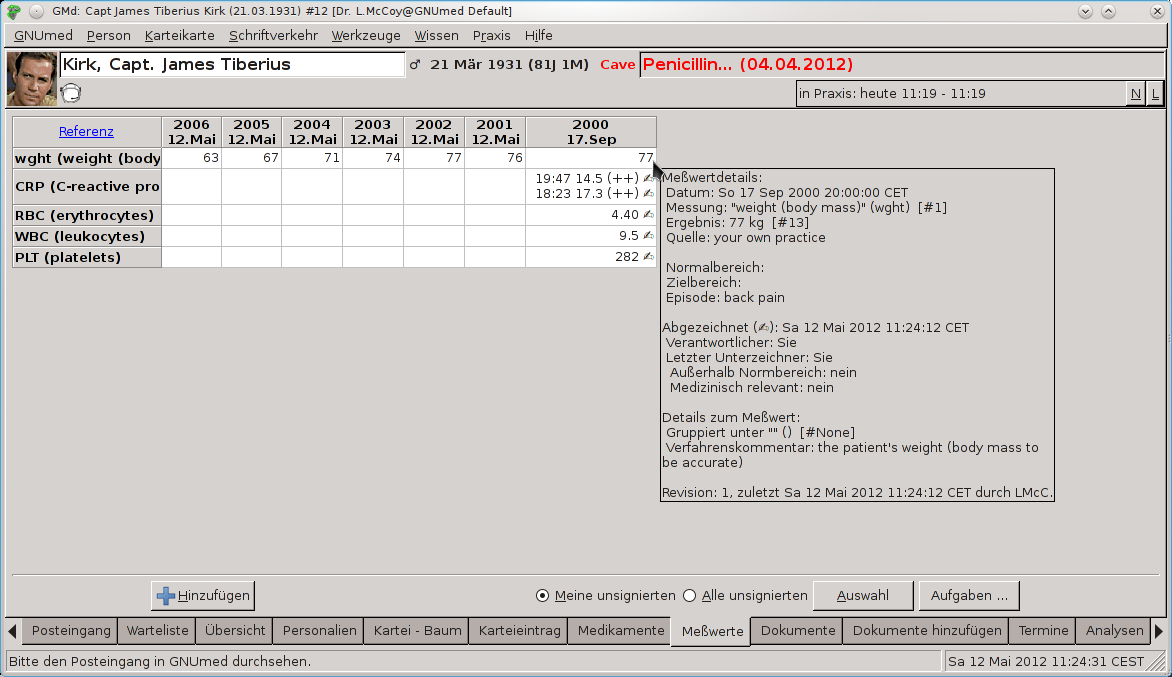
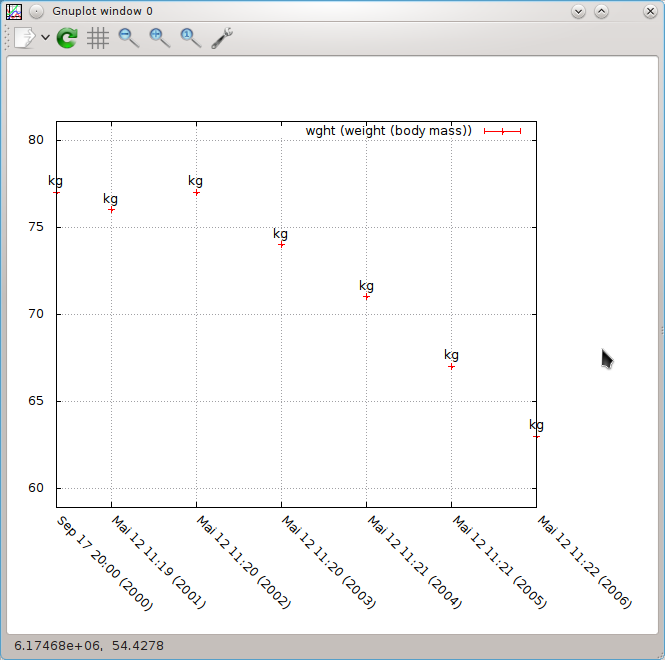
I agree. Attached find a trend for Kirk's weight both in the
table and graphed. GNUmed already supports the latter. It
can currently plot one or two (say, weight + Hb)
measurements against time. Plot templates can be created by
the user, as usual (it's a bit complicated at first,
though).
> But if you get a pop up after entering a weight in
> field provided showing graphical trend over previous few
> visits ,
That's an excellent idea. I've put it on my TODO list for 1.3.
> similarly algorithms may be suggested using emr for a
> symptom or symptom complex evaluation.
To at least approximate something like that we so far only
offer the text expansion macros - which are now active, in
the sense that the user can define places where she wants to
insert values after calling up an expansion. GNUmed will
then ask for values in the context of the macro template.
There's no calculations, though.
Karsten
--
GPG key ID E4071346 @ gpg-keyserver.de
E167 67FD A291 2BEA 73BD 4537 78B9 A9F9 E407 1346
 screenshot_001.png
Description: PNG image
screenshot_002.png
Description: PNG image