[Top][All Lists]
[Date Prev][Date Next][Thread Prev][Thread Next][Date Index][Thread Index]
Re: [Help-glpk] Mathprog > SQLite/MySQL > GNUPlot - (Graphing LP and MI
|
From: |
glpk xypron |
|
Subject: |
Re: [Help-glpk] Mathprog > SQLite/MySQL > GNUPlot - (Graphing LP and MIP results) |
|
Date: |
Sun, 13 Jun 2010 11:48:22 +0200 |
Hello Noli,
> Gnuplot users, I need you help how to plot the result - "plot" function
In examples/transp.mod add
solve;
printf '""' > 'transp.dat';
printf {j in J} ' "%s"', j >> 'transp.dat';
printf '\n' >> 'transp.dat';
for {i in I} {
printf '"%s"', i >> 'transp.dat';
printf {j in J} ' %f', x[i,j] >> 'transp.dat';
printf '\n' >> 'transp.dat';
}
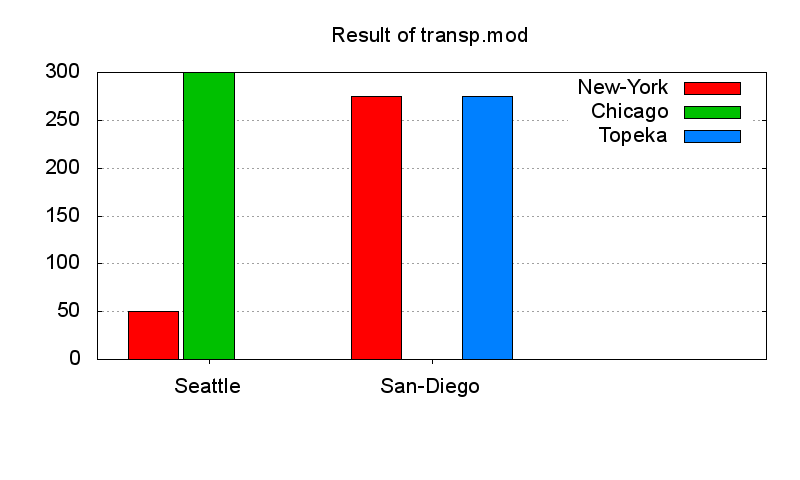
This will create the follwing content in file transp.dat:
"" "New-York" "Chicago" "Topeka"
"Seattle" 50.000000 300.000000 0.000000
"San-Diego" 275.000000 0.000000 275.000000
Gnu-Plot expects data for histograms in multiple columns.
Create a file transp.gnuplot with the following lines:
set terminal png truecolor transparent font "Arial, 16" size 800x600
set output "transp.png"
set title 'Result of transp.mod'
set style data histogram
set style histogram cluster gap 1
set style fill solid border -1
set boxwidth 0.9
set bmargin 5
set grid y
set xrange [-.5:2.5]
set xtics out nomirror
plot 'transp.dat' \
using 2:xtic(1) title columnheader(2), \
for [i=3:4] '' using i title columnheader(i)
exit
Execute
gnuplot.exe transp.gnuplot
And you get the appended transp.png.
Best regards
Xypron
--
GMX DSL: Internet-, Telefon- und Handy-Flat ab 19,99 EUR/mtl.
Bis zu 150 EUR Startguthaben inklusive! http://portal.gmx.net/de/go/dsl
 transp.png
Description: PNG image
- Re: [Help-glpk] Mathprog > SQLite/MySQL > GNUPlot - (Graphing LP and MIP results),
glpk xypron <=