I have been trying to get the following function to graph properly in Octave, but I get nothing returned.
 <-- supposed to be an image, might be added as an attachment.
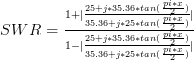
I put it in as:
x=linspace(-10,10,1);
a=(1+abs((25+j*35.36*tan(pi*x\2))\(35.36+j*25*tan(pi*x\2))))\(1-abs((25+j*35.36*tan(pi*x\2))\(35.36+j*25*tan(pi*x\2))));
plot(x,a);
But I end up with a blank graph. Can anyone point out what I am doing incorrectly on this? I have even tried making the "j's" "i's", but I get nothing returned. Is it because of my imaginary use? I would think that using abs() wouldtake care of that. I get an answer returned after I enter the "a" line, but it is a single answer and not an array.
Jason