[Date Prev][Date Next][Thread Prev][Thread Next][Date Index][Thread Index]
[colorbar] wrong dimensions with 'axis square'
|
From: |
Martijn |
|
Subject: |
[colorbar] wrong dimensions with 'axis square' |
|
Date: |
Tue, 24 Aug 2010 09:14:58 +0200 |
Hi,
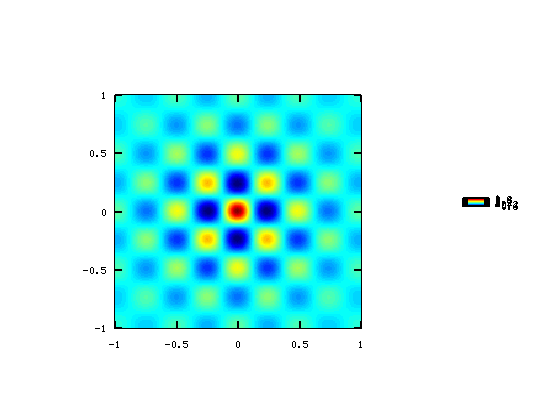
When I draw a colorbar along a pcolor image and make the axes square
(axis('square')), the dimensions of the colorbar are also changed, and
the colorbar becomes enreadible low, as shown in the attached image.
If others can reproduce this, I will file a bug. I am running octave
3.2.3 and gnuplot 4.2. The problem occurs both with the X11 and the wxt
backend. Do you get the same results?
Martijn
P.S. The image can be produced using these commmands:
x=-1:0.01:1;
y=x;
[X,Y]=meshgrid(x,y);
Z=cos(4*pi*X).*cos(4*pi*Y).*exp(-2*sqrt(X.^2+Y.^2));
shading('interp')
pcolor(X,Y,Z)
shading('interp')
axis('square')
cb=colorbar()
 cb.png
Description: PNG image
- [colorbar] wrong dimensions with 'axis square',
Martijn <=
- Re: [colorbar] wrong dimensions with 'axis square', Martin Helm, 2010/08/24
- Re: [colorbar] wrong dimensions with 'axis square', Martin Helm, 2010/08/24
- Re: [colorbar] wrong dimensions with 'axis square', Ben Abbott, 2010/08/24
- Re: [colorbar] wrong dimensions with 'axis square', Martin Helm, 2010/08/24
- Re: [colorbar] wrong dimensions with 'axis square', bpabbott, 2010/08/24
- Re: [colorbar] wrong dimensions with 'axis square', bpabbott, 2010/08/25
- Re: [colorbar] wrong dimensions with 'axis square', Ben Abbott, 2010/08/25
- Re: [colorbar] wrong dimensions with 'axis square', Martin Helm, 2010/08/25