Hi All
I am trying to plot a “waterfall” diagram like this: http://www.originlab.com/ftp/forum_and_kbase/Images/3DWaterfall_fig.jpg
I can’t use the “waterfall(…)” function, because this relies on data gridded on a 2-D rectangular region in the x-y plane (http://octave.sourceforge.net/octave/function/waterfall.html). This is not the case with my data, and I don’t want to interpolate.
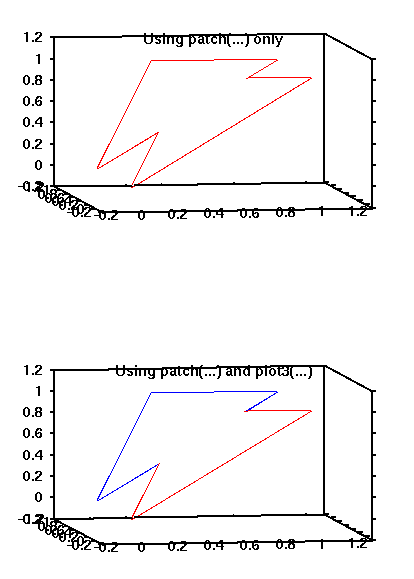
My approach was to plot the individual “slices” of the waterfall using the patch(…) function. After staring at the patch(…) documentation and reverse engineering the examples for many hours, I managed to make this work using Octave 3.6.4 and the FLTK plotting backend (on Debian Linux). However, using Gnuplot (Octave 3.6.4/Debian or Octave 3.8.2 on Mac OS X), the borders/edges of the patches are not drawn well, so it’s impossible to see the borders of the patches in the areas where they overlap. I tried to draw the edges of the patches using plot3(…), but this didn’t work either. Below is a simplified example code demonstrating this. I also attached the plots resulting from this code.
I’d like to make this work independent of the plotting backend. I’d be happy to for ideas or suggestions.
Matthias
Code example:
—————————————————————
% x/y/z vertices of first patch (triangle at y=0):v1 = [ 0 0 0 ; 0.3 0 1 ; 1 0 1 ];
% vertices of second patch (v1 offset to y=1):
v2 = v1; v2(:,2) = v2(:,2)+1;
% face definitions (identical for both patches):
f = [ 1 2 3 ];
% plot patches:
% ...using patch function only:
clf;
subplot (2,1,1);
p1 = patch ( 'Vertices',v1, 'Faces',f,'Edgecolor',[0 0 0], 'Facecolor',[1 1 1] , 'Linewidth',2 ); hold on; % first patch
p2 = patch ( 'Vertices',v2, 'Faces',f, 'Edgecolor',[0 0 0], 'Facecolor',[1 1 1] , 'Linewidth',2 ); % second patch
axis ([-0.2 1.3 -0.2 1.2 -0.2 1.2]); view(-10,10); title ('Using patch(...) only'); % format plot
hold off
% ...using patch and plot3 to draw the edges:
subplot (2,1,2);
p1 = patch ( 'Vertices',v1, 'Faces',f,'Edgecolor','none', 'Facecolor',[1 1 1] ); hold on; % first patch, no edges
b1 = [ v1 ; v1(1,:) ]; plot3(b1(:,1),b1(:,2),b1(:,3), 'Color',[0 0 0] , 'Linewidth',2 ); % draw edges
p2 = patch ( 'Vertices',v2, 'Faces',f,'Edgecolor','none', 'Facecolor',[1 1 1] ); % second patch, no edges
b2 = [ v2 ; v2(1,:) ]; plot3(b2(:,1),b2(:,2),b2(:,3), 'Color',[0 0 0] , 'Linewidth',2 ); % draw edges
axis ([-0.2 1.3 -0.2 1.2 -0.2 1.2]); view(-10,10); title ('Using patch(...) and plot3(...)'); % format plot
hold off;
—————————————————————