help-octave
[Top][All Lists]
Advanced

[Date Prev][Date Next][Thread Prev][Thread Next][Date Index][Thread Index]

Re: Trying to make a respectable looking Hist3 plot and having big diffi


From: Nicholas Jankowski
Subject: Re: Trying to make a respectable looking Hist3 plot and having big difficulty
Date: Wed, 2 Aug 2017 11:07:15 -0400

On Wed, Aug 2, 2017 at 9:04 AM, Tim Pierce <address@hidden> wrote:
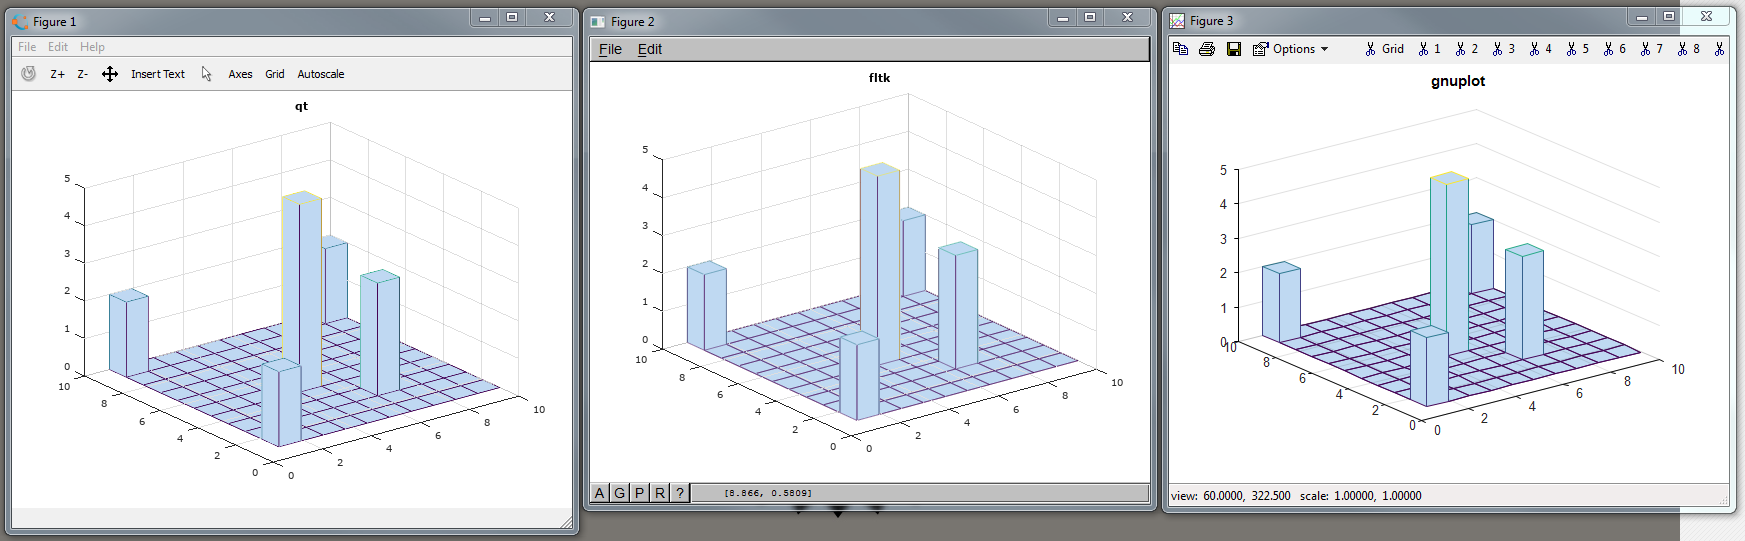
Ah so you got same as me? Thats interesing.
I should add I'm using a Windows install - this may haev a lot to do with it...

I'm actually not intelligent enough (yet) to understand how to switch between graphics packages, or how to use them - I'm just using default Octave.

I'm using Octave 4.2.1 and statistics 1.3.0 as well. Similar to the above, output looks fine on all three graphics toolkits, gnuplot being a bit less 'clean' than the others, comparison image attached.

Octave (at least on windows) is built with 3 available graphics toolkits: qt (default), gnuplot, and fltk.  you check them and switch between them using the 'graphics_toolkit' command.  So, I produced the attached output with the following:

>>>> X = [
    1    1
    1    1
    1   10
    1   10
    5    5
    5    5
    5    5
    5    5
    5    5
    7    3
    7    3
    7    3
   10   10
   10   10];
>> gt = "qt";graphics_toolkit(gt); figure; hist3(X);title(gt);
>> gt = "fltk";graphics_toolkit(gt); figure; hist3(X);title(gt);
>> gt = "gnuplot";graphics_toolkit(gt); figure; hist3(X);title(gt);


Attachment: hist3_output.PNG
Description: PNG image


reply via email to

[Prev in Thread] Current Thread [Next in Thread]