Hi,
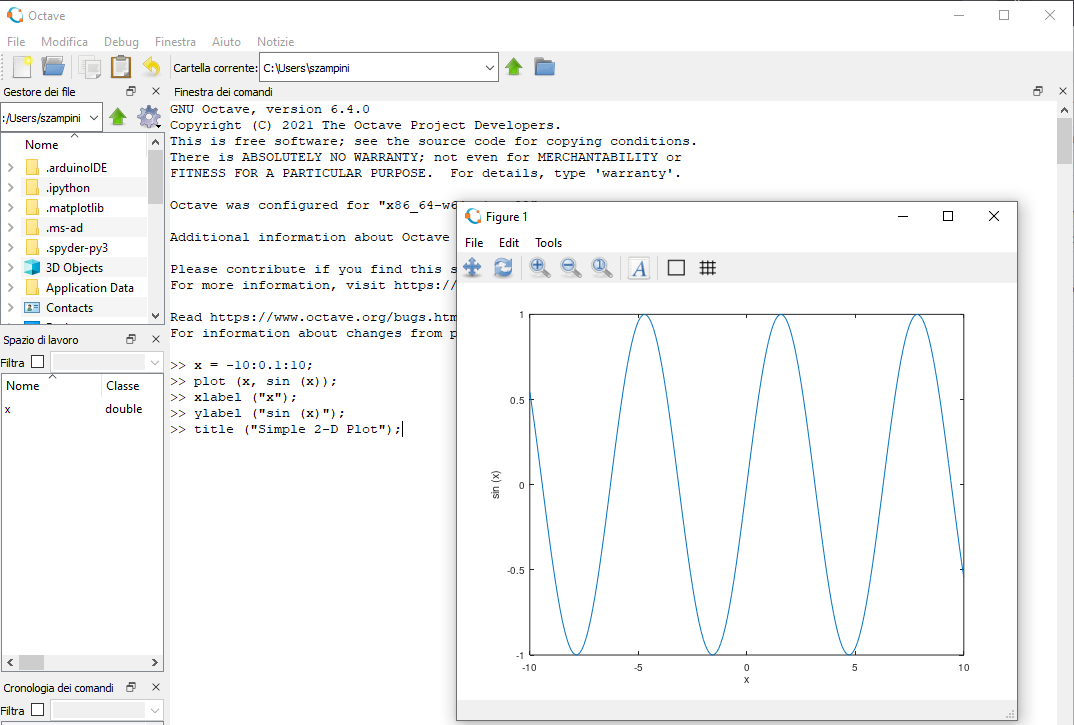
it seems ok, in fact, I copied your code as it is and I get:
Try again,
Samuele
Samuele
|
| From: | Samuele Zampini |
| Subject: | Re: Question |
| Date: | Wed, 29 Mar 2023 15:16:23 +0200 |
Hello good evening. Could you help me? I try to graph in Octave but nothing appears on the graph screen.x = -10:0.1:10;
plot (x, sin (x));
xlabel ("x");
ylabel ("sin (x)");
title ("Simple 2-D Plot");
----------
We are transitioning to a web based forum
for community help discussions at
https://octave.discourse.group/c/help
| [Prev in Thread] | Current Thread | [Next in Thread] |