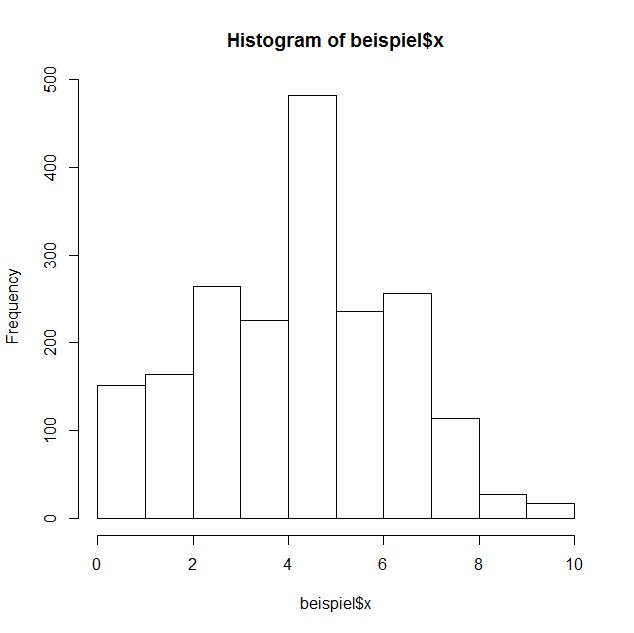
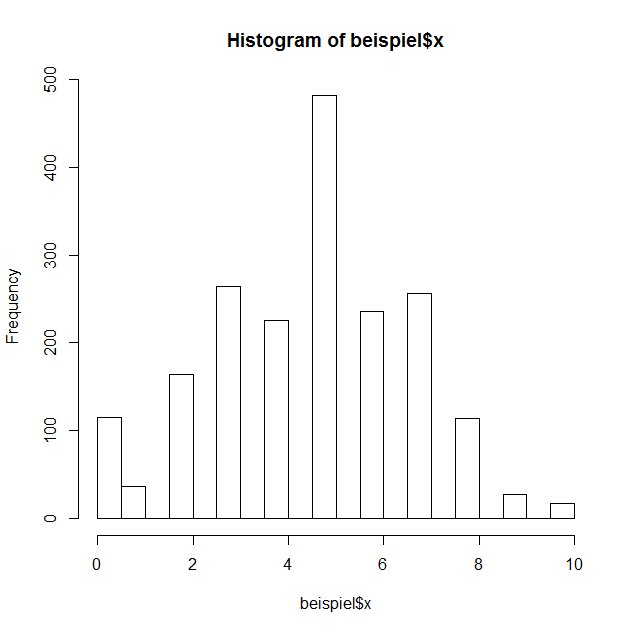
I tried to reproduce the histogram that PSPP created in R. As you
can see on the attached files, R also created a histogram with
gaps if the number of classes is too high (here: 16 which is
similar to the number PSPP used), but a histogram with no gaps if
the number of classes is lower (10 classes). So, another aspect in
addition to the necessary distinction between histogram and bar
chart is the choice of an appropriate number of classes.
Dear Sir or Madam,
I've just read your message in the PSPP list. One problem is
that your data are discrete with a small number of categories,
but histograms are most useful for continuous data. For discrete
data with a small number of categories, a bar chart is more
appropriate. I attached you a pdf file which contains a
histogram of your data (variable x), a histogram of continuous
data (variable y) and a bar chart of your data (variable x).
Obviously, the histogram is most appropriate for the continuous
data (variable y), but a bar chart is most appropriate for
discrete data (variable x).
Bonne journée,
Oliver Walter
Am 06.08.2017 um 11:57 schrieb ftr
public:
Hi,
I want to graph a simple frequency
distribution of ta variable called soctrust from a national
sample. I compare the histogram from a FREQUENCIES command
with a diagramme from a GRAPH command.
The variable can have integer values
from 0 to 10.
FREQUENCIES
/VARIABLES= soctrust
/FORMAT=AVALUE TABLE
/STATISTICS=NONE
/HISTOGRAM=NORMAL.
Graph /histogram (Normal) = soctrust.
The resulting graphs are different, but both are deficient.
This is the frequency distribution.
|
Valeur
|
Fréquence
|
|
0
|
115
|
|
1
|
36
|
|
2
|
164
|
|
3
|
243
|
|
4
|
226
|
|
5
|
482
|
|
6
|
236
|
|
7
|
256
|
|
8
|
114
|
|
9
|
27
|
|
10
|
17
|
The GRAPH procedure gives the annexed histogram dp-1.png.
The FREQUENCIES procedure gives the annexed histogram dp-1.png.
What is surprising is that the two procedures give different
graphs, and that in both the data are not truthfully mirrored by
the visualisation. There should be no empty space between two
values.
Regards,
-ftr
_______________________________________________
Pspp-users mailing list
address@hidden
https://lists.gnu.org/mailman/listinfo/pspp-users