From Martin Braun:
>My preference is to build the demod/sync chain with it's own blocks, and then just output the complex symbols
> into either an X/Y plot (WX) or the QT Constellation Sink
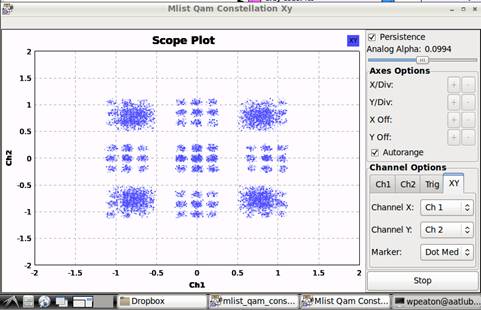
Even an X/Y plot ends up looking funny. I’ve attached a GRC file for X-Y, and when you turn on persistence, it looks better. But it’s very strange. Maybe my bits_per_symbol is wrong. Or maybe the sample rate for the X-Y chart should be different than the random sample rate? Here’s the 4 QAM X-Y.
From: address@hidden [mailto:address@hidden On Behalf Of Bill Eaton
Sent: Friday, July 17, 2015 11:13 AM
To: 'Neel Pandeya'; 'Sylvain Munaut'
Cc: address@hidden
Subject: Re: [Discuss-gnuradio] trouble with QAM mod/ WX GUI Constellation Sink
> Could you post your flowgraph (the GRC file)?
> --Neel
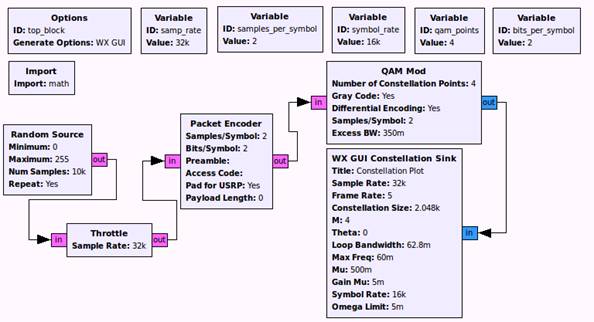
Attached are two flowgraphs:
1. The original flowgraph with only QAM mod and WX GUI Constellation
2. Fancier flowgraph adding demod and BER
> AFAIK the constellation sink just can't do QAM.
> Sylvain
AHA! Thanks for that confirmation. Maybe that explains why the 4 QAM constellation looks so poor. Is there a good way that I could make constellation charts with a little more effort? In my ideal world, I could make a constellation chart for 16 QAM, and then superimpose unfilled circles on the chart representing limits for max allowed EVM. If I can’t get to EVM, then I might try to use BER. Browsing through GRC, I couldn’t find any I/Q blocks…
My first attempts at BER are not going well. With the attached file, I get over 200% rate. Which is a little high, especially with zero impairments. I don’t know what I could be missing. Maybe my bits per symbol calculation is faulty?
samp_rate = 32k (default)
samples_per_symbol = 2 (no idea what this really should be)
symbol_rate = samp_rate/samples_per_symbol
qam_points = number of points in constellation (e.g. 4 or 16)
bits_symbol = math.log(qam_points)/math.log(2)
From: Neel Pandeya [mailto:address@hidden]
Sent: Thursday, July 16, 2015 10:46 PM
To: Bill Eaton
Cc: address@hidden
Subject: Re: [Discuss-gnuradio] trouble with QAM mod/ WX GUI Constellation Sink
Could you post your flowgraph (the GRC file)?
--Neel
On 16 July 2015 at 18:23, Bill Eaton <address@hidden> wrote:
I have a desire to use GNURadio + USRP to run a 16 QAM signal through an amplifier, demodulate, and calculate BER or EVM or some measure of linearity. That’s the long term goal.
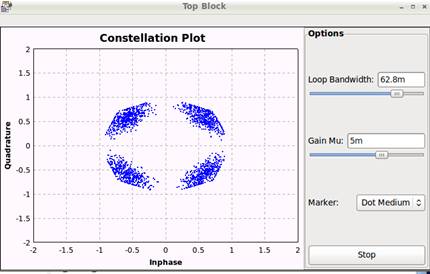
For the short term, I thought I would take baby steps. And I got stuck trying to make pretty constellation plots. My flowgraph is below. It sort of behaves like I expect for 4 QAM, but it doesn’t do so good for 16 QAM. In the WX GUI Constellation widget, there is an option called M. Is this at all related to the number of constellation points? If so, the max is 8 and that might explain why I cannot make a nice 16 QAM constellation diagram. Is there anything else I’m doing wrong?
_______________________________________________
Discuss-gnuradio mailing list
address@hidden
https://lists.gnu.org/mailman/listinfo/discuss-gnuradio