Description: PNG image
|
| From: | richard terry |
| Subject: | Re: [Gnumed-devel] How to display your results |
| Date: | Thu, 7 Jul 2011 09:04:34 +1000 |
| User-agent: | KMail/1.12.4 (Linux/2.6.31-23-generic-pae; KDE/4.3.5; i686; ; ) |
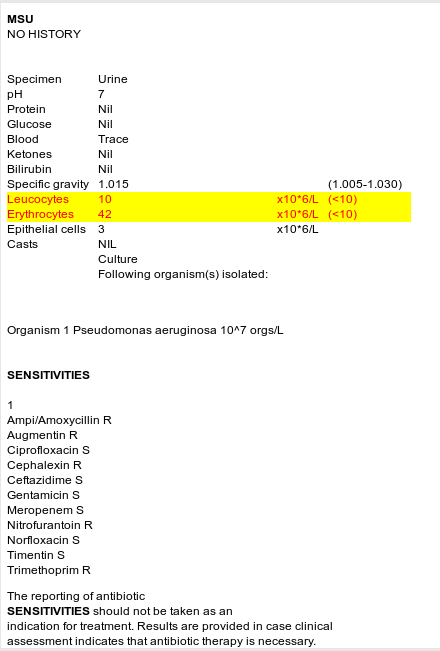
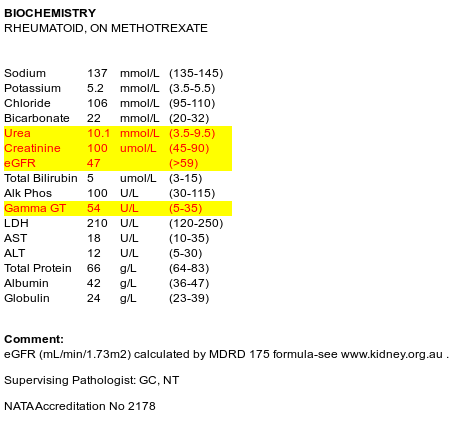
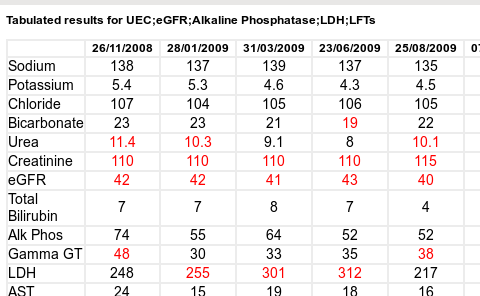
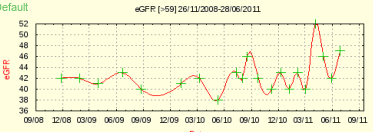
From my observation of one of the picture's Jim attatched I think you'll find a
re-think needed of your strategy - one of the things I think gnuMed lacks is
dealing with medical data in brush strokes as opposed to pixels - always
trying to confine it to textboxes of inadequate size.

There is only one logical way of displaying hl7  - is in html or an equivalent
- with which you  can do all sorts of fancy things, for example as shown here
highlighting ( or could put in web links, or links to decision support etc),
and also one can include images, as here in AU we are starting to get for
example pictures of say a vascular proceedure included in the hl7 file itself,
which can then be embedded into the html). An html widgit also auto-resizes.

From the picture Jim included  I'd reckon your trying to stuff it into
textboxes, there is no way this will ever work or be useful in clinical
practice.

I've done a few screen dumps of part of the screen display from one of my
patients notes to show how data can be displayed.

The user only needs to view the result. I they want to copy it they can
swipe/copy part of a result. You already have the granular data so they can
graph the results from a popup menu option, or you can present tabulated
results over time or a particular date range etc, Using HTML you can present 1
or all in the same space at the same time.

As I said previously I spent mega-hours on this after I left the gnuMed
project some years ago when I decided to take the direction of writing my own
software as I felt my idea's for gnuMed would never be implemented.

Regards

Richard


> If we stuff all the above Organism identification and culture and
>  sensitivity results in a test_result table cell, how does the user
>  properly "see" it? A tooltip comes to mind, *but* we already use
>  measurement result tooltips to display metadata (see screen shot).
>
> -- Jim (sig 1)
![]() 4jim.png
4jim.png
Description: PNG image
![]() 5jim.png
5jim.png
Description: PNG image
![]() 6jim.png
6jim.png
Description: PNG image
![]() 7jim.png
7jim.png
Description: PNG image
| [Prev in Thread] | Current Thread | [Next in Thread] |