pspp-users
[Top][All Lists]
Advanced

[Date Prev][Date Next][Thread Prev][Thread Next][Date Index][Thread Index]

Windows PSPPIRE/PSPP is pretty wonky


From: Alan Mead
Subject: Windows PSPPIRE/PSPP is pretty wonky
Date: Tue, 30 Dec 2014 16:58:48 -0600
User-agent: Mozilla/5.0 (Windows NT 6.1; WOW64; rv:31.0) Gecko/20100101 Thunderbird/31.3.0

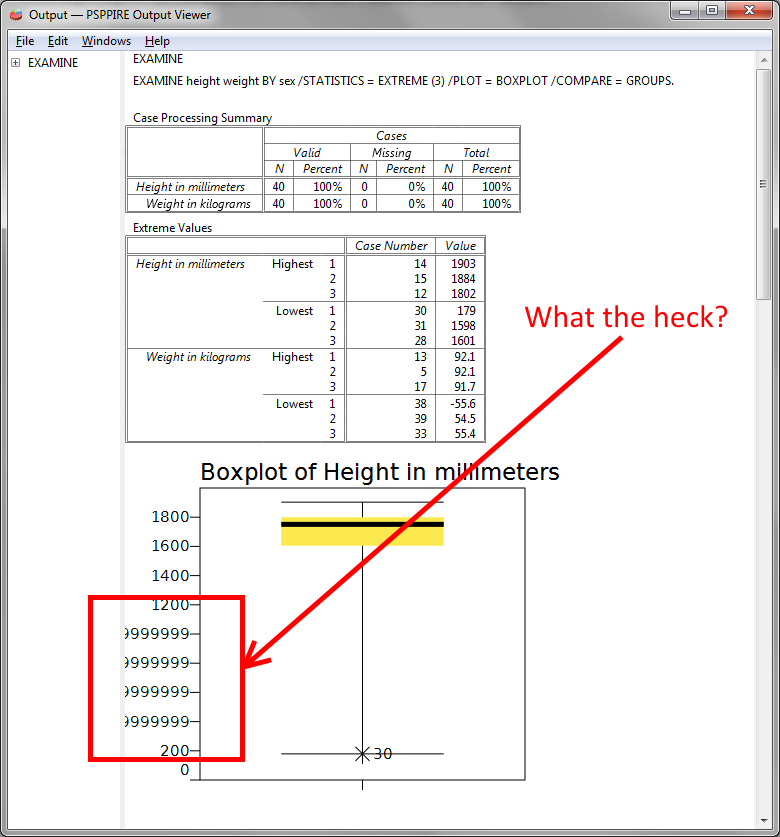
John and Harry,

PSPPIRE.exe 0.8.4-g5ce6b1 (and the associated PSPP) is pretty wonky.  Paste doesn't work correctly (I believe that's a know issue?). To paste syntax into the syntax window, I had to right-click and choose paste; neither Control-v or Edit > Paste would paste the text.

And Run > Current line wasn't working (but now I cannot replicate it, I'm guessing it has to do with where the cursor was rather than which line of the syntax window was "shaded"). What was most annoying is that by "not working" I mean that the output window would flash but there was no additional output in the window and no warning or error.

And then look at the boxplot I got when I ran Robin's syntax on the physio data (attached "boxplot.png")... I don't use examine and I don't know what " /STATISTICS = EXTREME (3)" is meant to do, but I know what a boxplot is and there shouldn't be values like 9999999 between 1200 and 200 on the y-axis.

Regarding the actual algorithm, the boxplot I get from SPSS is attached as "boxplot2.png".  I think it's a lot more reasonable (albeit uglier). The main difference is the SPSS boxplot had short whiskers while PSPP's boxplot whiskers seems to include the entire range of the data (including the outlier). In the physio dataset, apparently there are some outliers like 30 mm for a human height.  That's the kind of thing that boxplots are supposed to help you find.  Maybe that's a bug in PSPP that the whisker length is just wrong?  Otherwise I think it would make more sense to limit the whiskers to some reasonable value like 1.5 times the inter-quartile range (or to the highest and lowest values that are within 1.5 times the inter-quartile range).

-Alan


On 12/30/2014 4:13 PM, Alan Mead wrote:
Robin,

It looks like you are running PSPP directly.  Maybe the manual tells you to do so, but you actually want to run PSPPIRE, the GUI shell.

When I install the latest 64-bit Windows PSPP from http://pspp.awardspace.com/ I can start PSPP(IRE) the same way I start all Windows 7 programs: Start > All programs > PSPP > PSPP

PSPPIRE is also the default handler for .sav files, so if you navigate to the examples folder ("C:\Program Files\PSPP\share\pspp\examples" or Start > All Programs > PSPP > Examples) and double-click on phisiology.sav, it should bring up the PSPPIRE data window.  On that window, select File > New > Syntax and paste your syntax ("EXAMINE height weight BY sex /STATISTICS = EXTREME (3) /PLOT = BOXPLOT /COMPARE = GROUPS.") into that window.  Then select Run > All.

The error about 'name' not being a variable is because name isn't a variable in the physio dataset. In PSPPIRE it's very easy to see what variables are n a dataset, especially using the "Variable View" tab of the data window.

When I start PSPPIRE and paste your shortened command (and add a trailing period) I get boxplots (see the screenshot).

-Alan


On 12/30/2014 10:59 AM, Robin Reeves wrote:
I think I should have sent this to the pspp-users e-mail rather than directly to Alan Mead. Aplogies.


From: address@hidden
To: address@hidden
Subject: Missing sub commands in PSPP
Date: Tue, 30 Dec 2014 16:53:29 +0000

Hi, 

I have just joined the PSPP users mailing list and am trying to find how to get boxplots.

I came across your thread dated Mon, 29 Dec 2014 09:38:27 -0600 with comments from Terence Palmer and John Darrington.

I too am a novice user of PSPP. I only recently downloaded 
release no. 0.8.4-g5ce6b1

 and I'm running it on Windows 7 on a 64 bit machine.

I can't find how to do box plots in psppire so I've been trying to use commands in the syntax window. I have been trying to do the second example at the bottom of page 131 of the PSPP manual with the "physiology.sav" data file.

The file has definitely loaded after using the GET FILE ="......physiology.sav". command.

I've then typed 
EXAMINE height weight BY sex /STATISTICS = EXTREME (3) /PLOT = BOXPLOT /COMPARE = GROUPS /ID = name.

The syntax editor told me there is no variable called 'name'.

I shortened the command to 
EXAMINE height weight BY sex /STATISTICS = EXTREME (3) /PLOT = BOXPLOT /COMPARE = GROUPS

and I get the results in 'Screenshot1' attached above but I can't see any box plots. Are they going somewhere other than the Syntax Window?

I've tried typing:
EXAMINE height weight BY sex /STATISTICS = DESCRIPTIVES /PLOT = HISTOGRAM /NOTOTAL
to repeat the first example on page 131 of the manual but with the "physiology.sav" data file but I still don't see a histogram.  I got the results in 'Screenshot2' attached above.

Please can you or anyone else help.

Many thanks,
Robin Reeves


-- 

Alan D. Mead, Ph.D.
President, Talent Algorithms Inc.

science + technology = better workers

+815.588.3846 (Office)
+267.334.4143 (Mobile)

http://www.alanmead.org

Announcing the Journal of Computerized Adaptive Testing (JCAT), a
peer-reviewed electronic journal designed to advance the science and
practice of computerized adaptive testing: http://www.iacat.org/jcat


_______________________________________________
Pspp-users mailing list
address@hidden
https://lists.gnu.org/mailman/listinfo/pspp-users

-- 

Alan D. Mead, Ph.D.
President, Talent Algorithms Inc.

science + technology = better workers

+815.588.3846 (Office)
+267.334.4143 (Mobile)

http://www.alanmead.org

Announcing the Journal of Computerized Adaptive Testing (JCAT), a
peer-reviewed electronic journal designed to advance the science and
practice of computerized adaptive testing: http://www.iacat.org/jcat

Attachment: boxplot.png
Description: PNG image

Attachment: boxplot2.png
Description: PNG image


reply via email to

[Prev in Thread] Current Thread [Next in Thread]